In this tutorial, we will take a look at 10 must-have GA4 reports for SEO, discussing the insights and actions that can be gained from these reports, as well as how to set them up.
1. Search Console Report #
Which Insights provide this report?
This report will help you understand which queries send traffic to your website and which organic landing pages engage.
How to set this report up
You don’t get this report by default on GA4 (very strangely).
First you need to associate GA property with a GSC site.
Next, to implement it navigate to the “Library” in the bottom left navigation, find the collection “Search Console” and publish it from there.
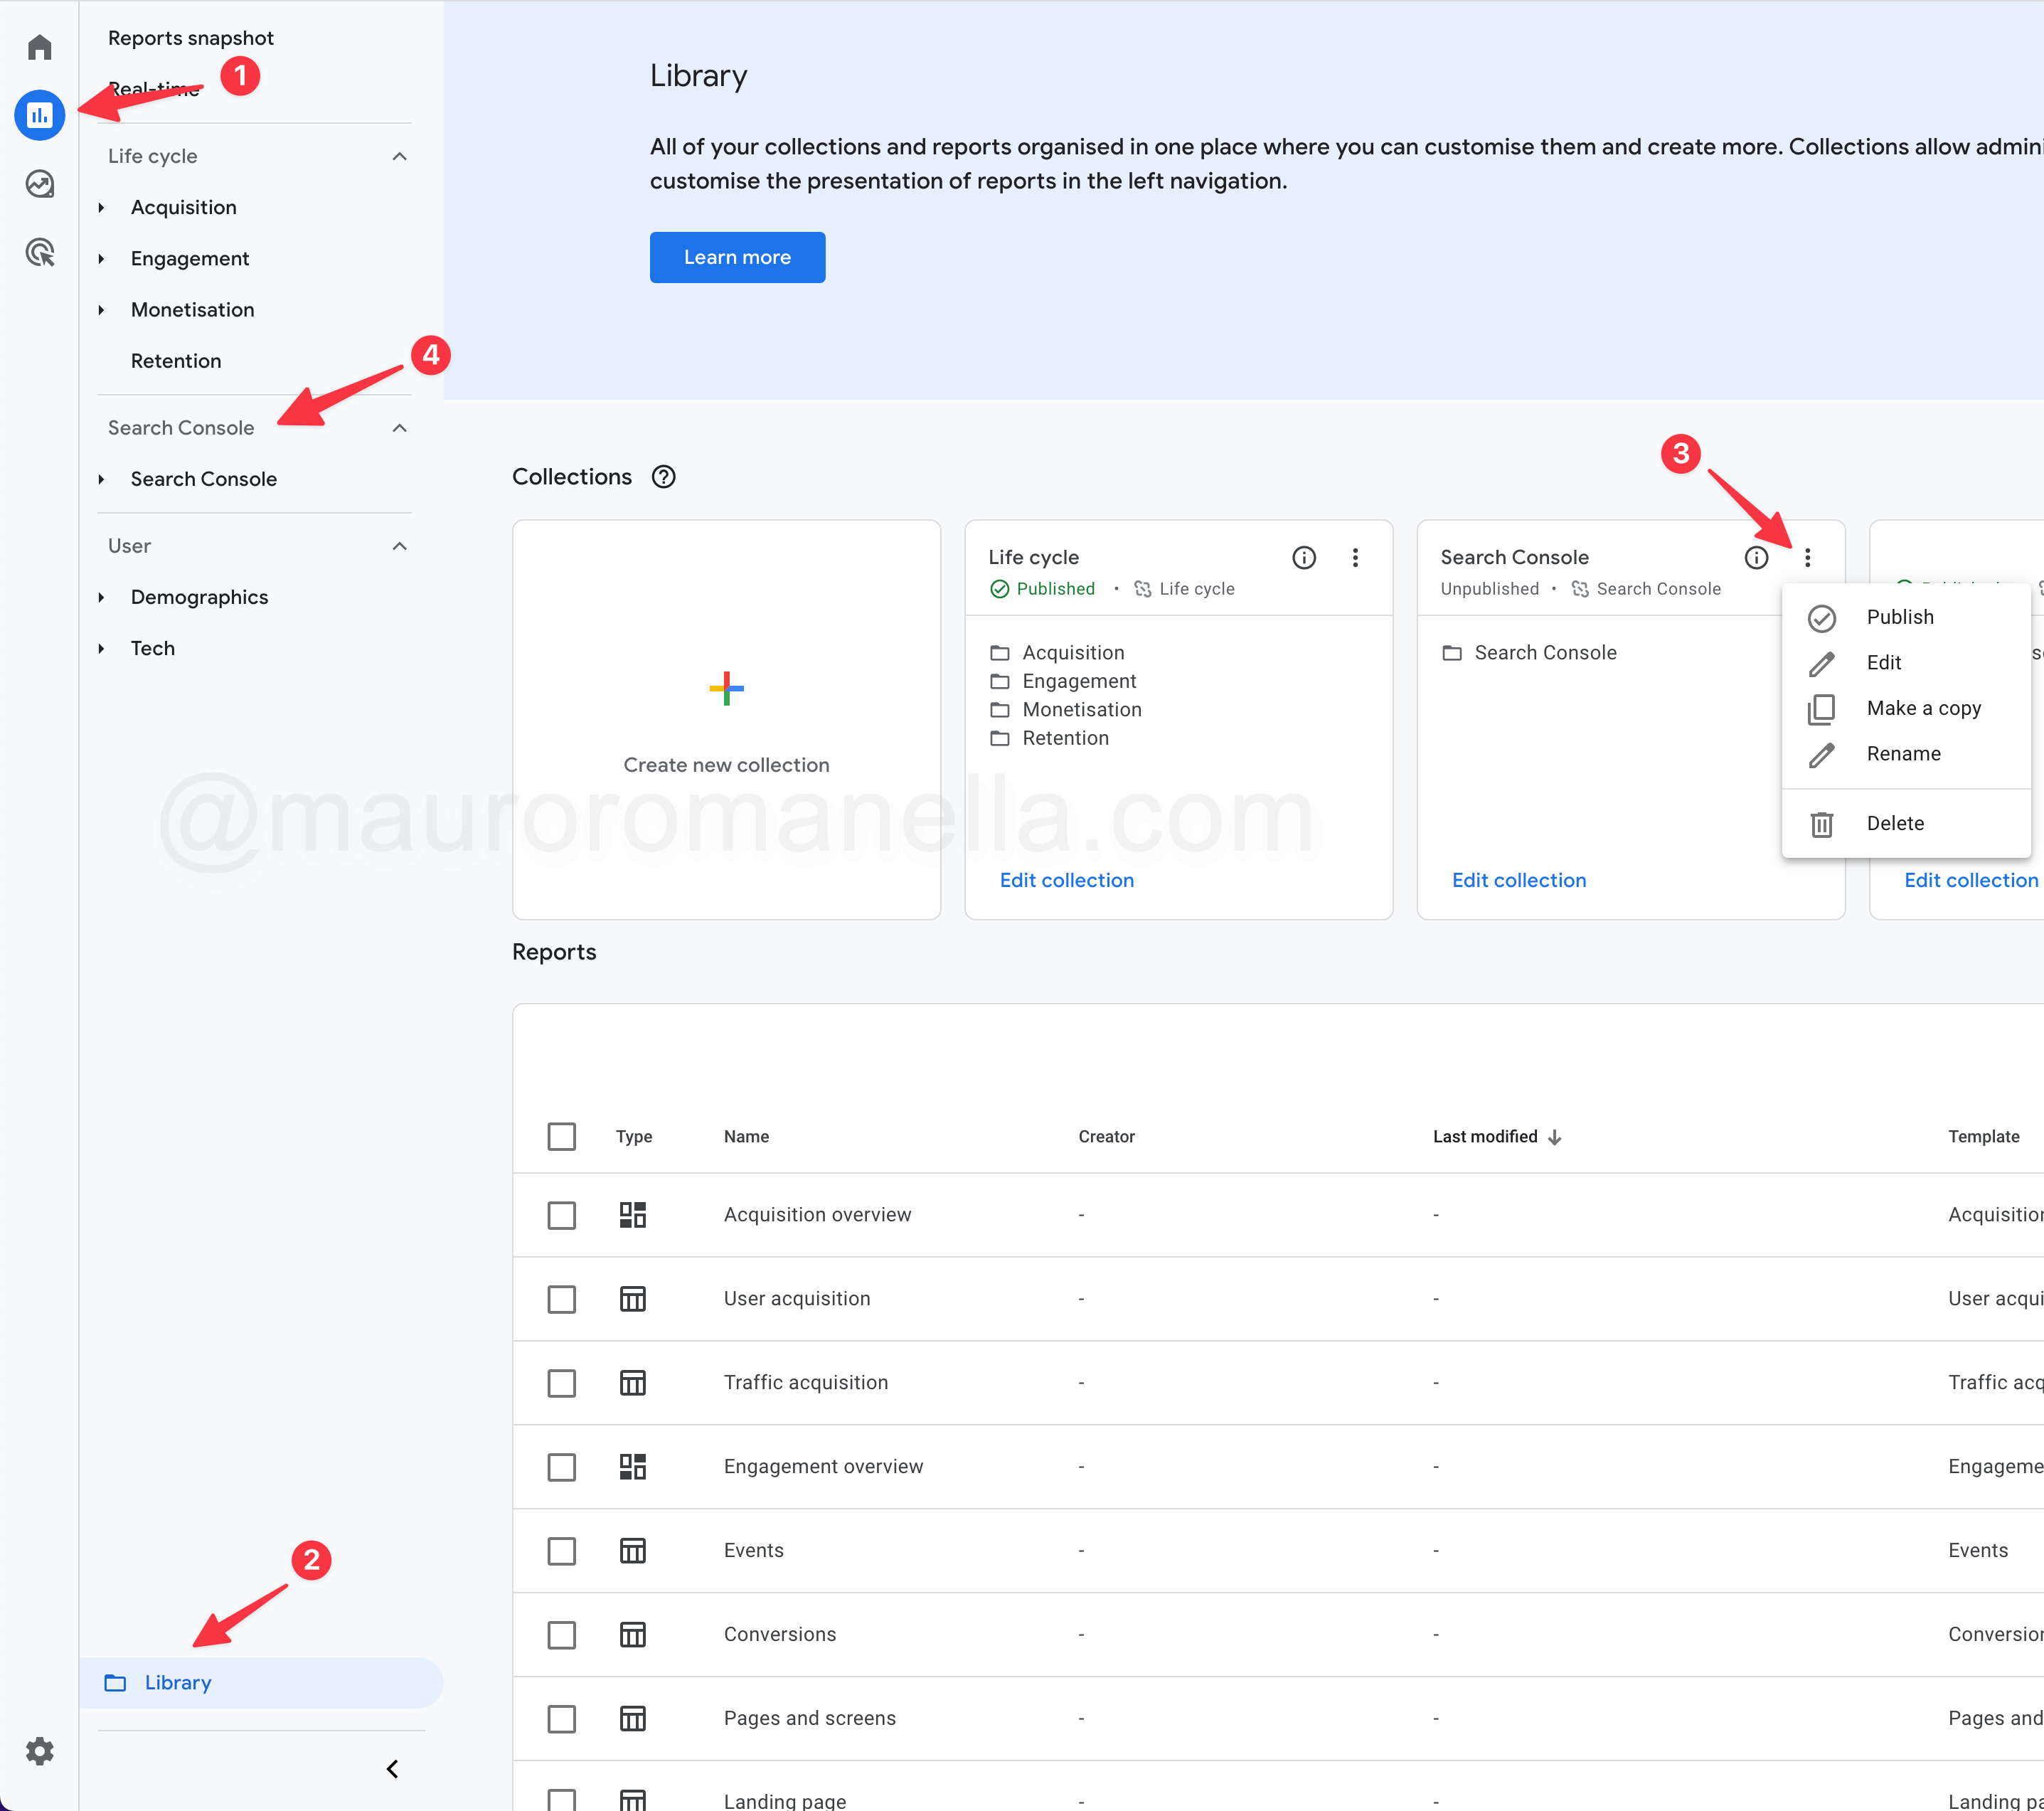
The integration allows you to access two new reports:
-
Google Organic Search Queries
This report provides valuable insights into which queries are driving traffic to your website. Additionally, you can see if you’re receiving the expected click-through rates or if there are issues with your search listing.
-
Google Organic Search Traffic
This report provides valuable insights into which landing pages are being engaged with by organic search traffic. By analysing this data, you can determine whether you are ranking the pages you expect to rank or if there is any cannibalisation.
It also allows you to determine if the traffic is going to the page you have optimised for that keyword. If not, then there may be something wrong that needs to be addressed.
Unfortunately the report does not tell you what keywords they are and it won’t tell you how many conversions.
As always, my recommendation is to read the Google official documentation for a more comprehensive understanding of the topic. .
2. Conversion Paths Report #

Which Insights provide this report?
This report will help you understand the visitor conversion journey on your website.
How to set this report up
-
Go into the explore tab, then click on path explorations.

Give it a name and then you go into the segment builder.
Here, you have the option to select a “user segment” based on the user’s entire lifetime interactions on your website or a “session segment”, which is specific to the particular time they visited your website as opposed to all the other times they may have visited.

In this case, I’m just taking a “session segment” because it’s the conversion session that I’m interested in.

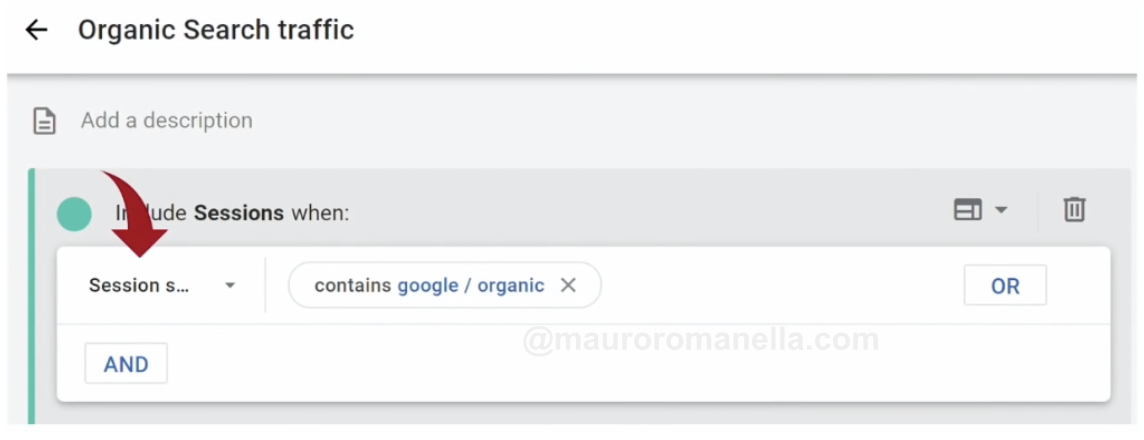
Now, I’m segmenting only by people who came on Google organic because I’m interested in SEO.

Ensure that the conversion event you are optimising for is accurate. This could be a purchase or a lead.

Now, you can track from the starting point how people navigate it from an organic search result to a conversion.

If you find that the majority of users are not completing the conversion process in the number of steps that your UX team said it would take, then there may be an issue that needs to be addressed.
3. SEO Path #
Which Insights provide this report?
In this case, our primary interest is to understand where visitors go on the website, regardless of whether they ultimately convert.
We want to know their actions after arriving through an organic search.
The key distinction from the previous analysis is that we are not focusing solely on those who made a purchase after an organic click. Instead, this information reveals the behaviour of any visitor who arrived organically on a landing page, detailing their activities on the site, irrespective of conversion outcomes.
How to set this report up
Very similar to the conversion path report, except here what we are doing is only segmenting by organic search traffic.
4. Segment Organic Traffic #
Which Insights provide this report?
What is the behaviour of visitors who come to your website through organic search.
How to set this report up
⚠️ Note: In GA4, The comparisons feature replace segments and filters of Universal Analytics.
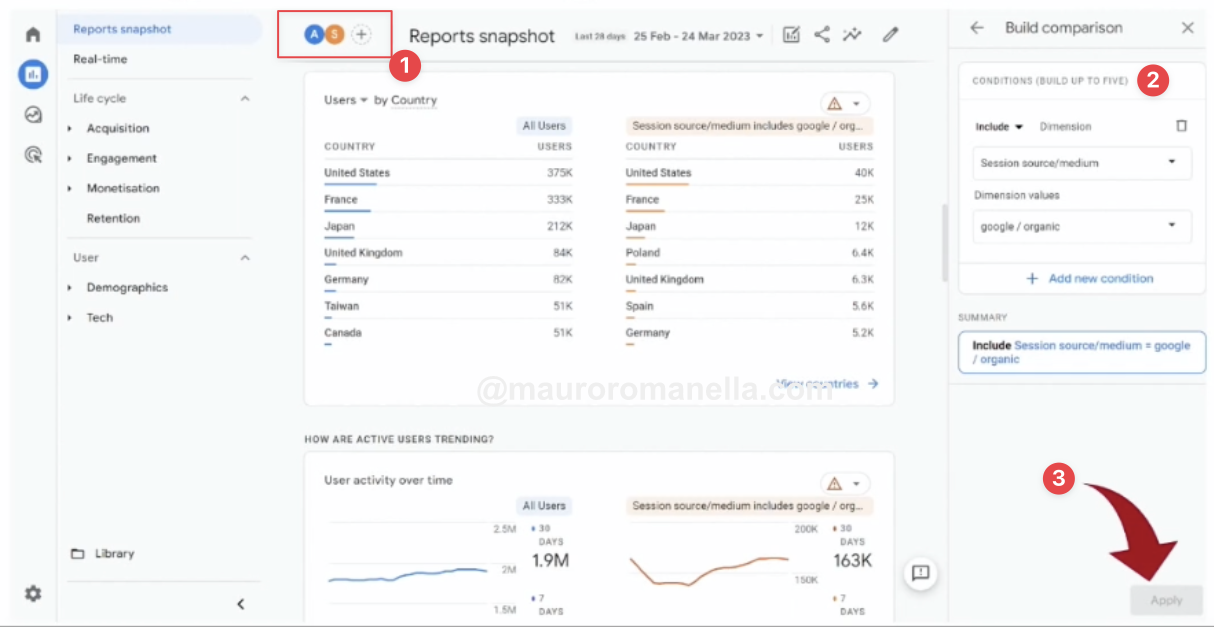
In GA4, the Comparison feature represents the fastest way to view specific subsets of data and compare subsets of data in a standard report.
On top of the standard GA4 reports you can click the plus button, in the comparison builder include only organic traffic and click “apply”.
5. Site Speed Report #
Which Insights provide this report?
How long the pages on the site take to load for real users.
How to set this report up
At present, GA4 does not have a report specifically for page timings and it does not provide any metrics related to page load times.
However, David Vallejo has created a useful tutorial demonstrating how to implement these metrics in GA4 using GTM. You can access the tutorial by visiting this URL.
6. Referral Traffic #
Which Insights provide this report?
Which external link sources are actually sending traffic and what that traffic is doing on your website.
How to set this report up
Unfortunately, the standard referrals report in GA4 doesn’t give you all this detail.
So, You need to create a report in the exploration section to find the actual URLs that are sending the referrals to your website.
To do that, navigate to Explorations and select “page referrer” as the dimension. This will display a list of all the referrers along with their corresponding number of clicks, duration of stay on the website, conversion rates and other related information for a specific time period.
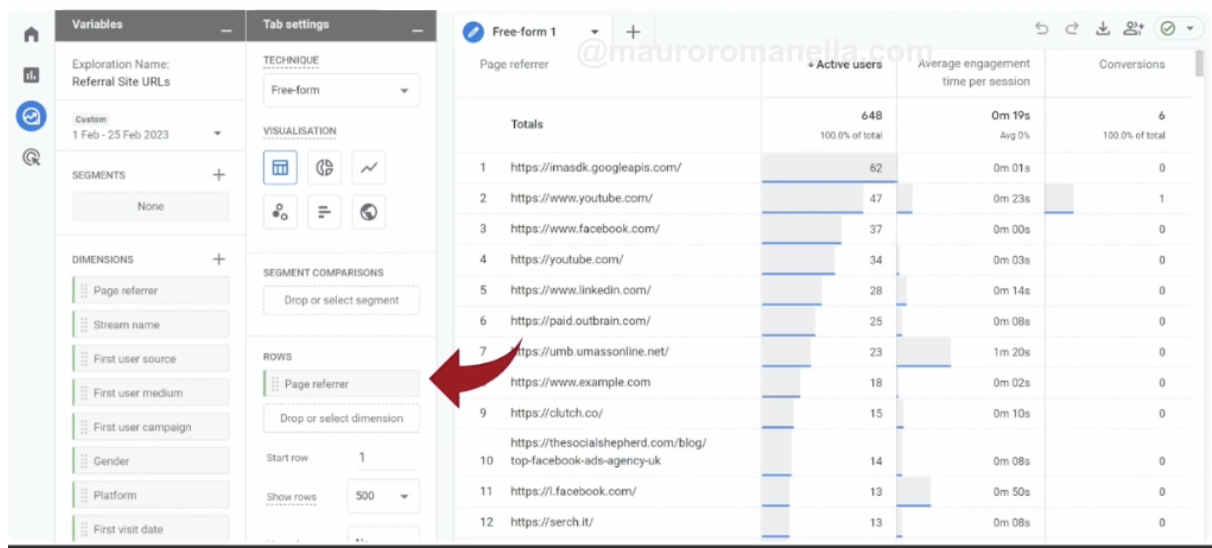
Add filters to pull out certain page referrer like: “google”; ”bing” and “googleads”
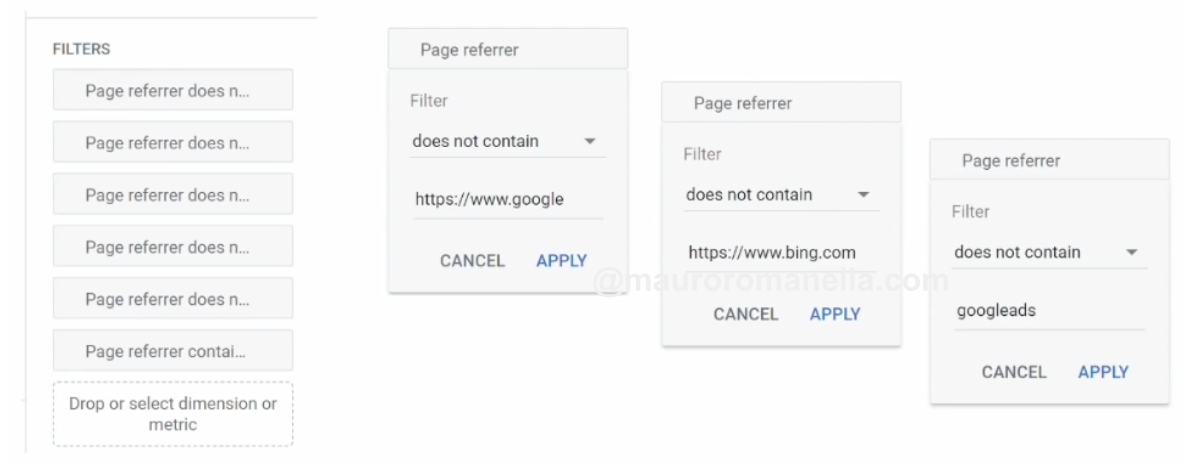
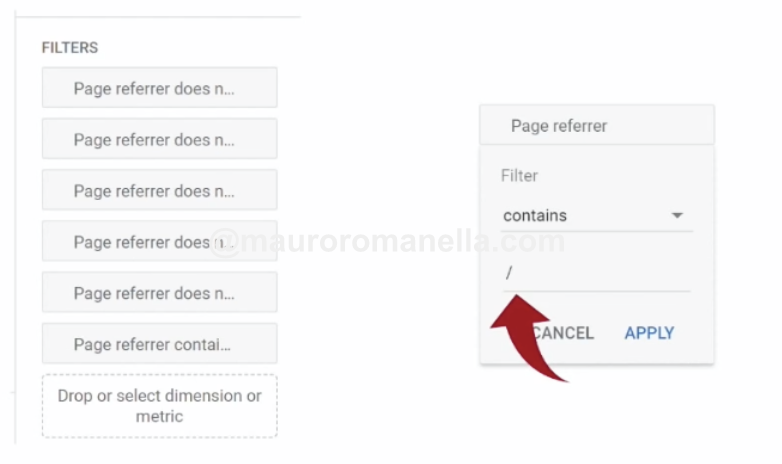
Also, to remove the “not sets” values, add a page referrer filter containing your Website root.
7. SEO Landing Pages #
Which Insights provide this report?
You get information about whether the optimised pages are truly engaging visitors and leading to conversions, or if they merely contribute to traffic statistics without benefiting your business.
How to set this report up
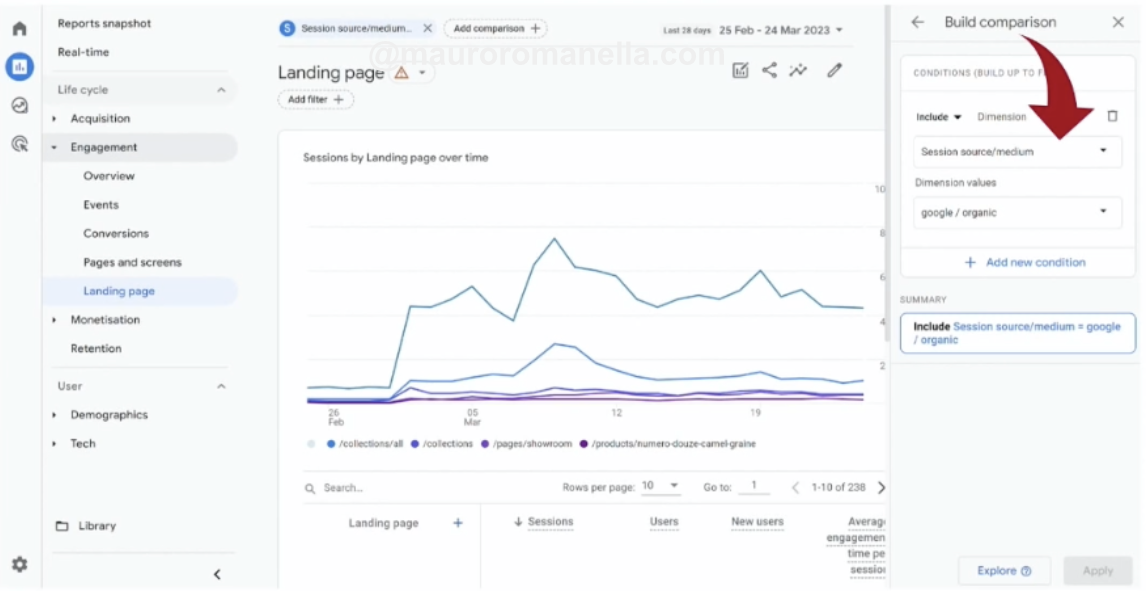
Go to the landing page report and filter the data by “Session Medium = Organic” and click “apply”
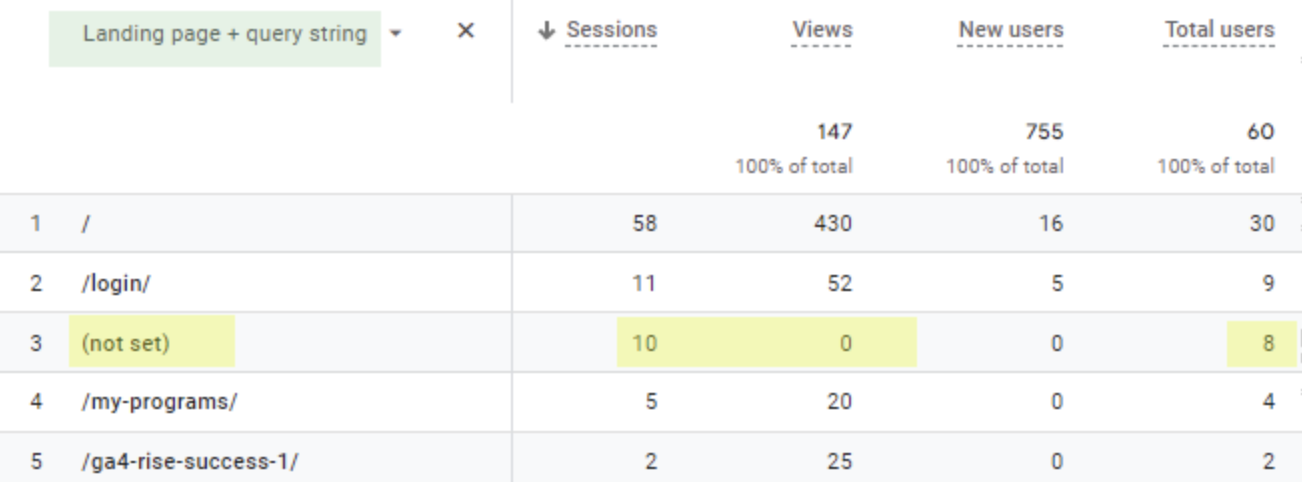
Clickinsight published an article that identified some limitations of the default landing page report in Google Analytics 4. These limitations include blank attributes or landing pages labeled as “not set”. To overcome these limitations, Clickinsight recommended using a customized report in the report library with the primary dimension set as “Landing page + query string”.
8. Data Stream Breakdown #
Which Insights provide this report?
In case you have several websites under a single GA4 property (such as .fr, .es, .de), along with subdomains or a combination of mobile app and standard desktop sites, you may need to analyse the data stream breakdown for a comprehensive view.
How to set this report up
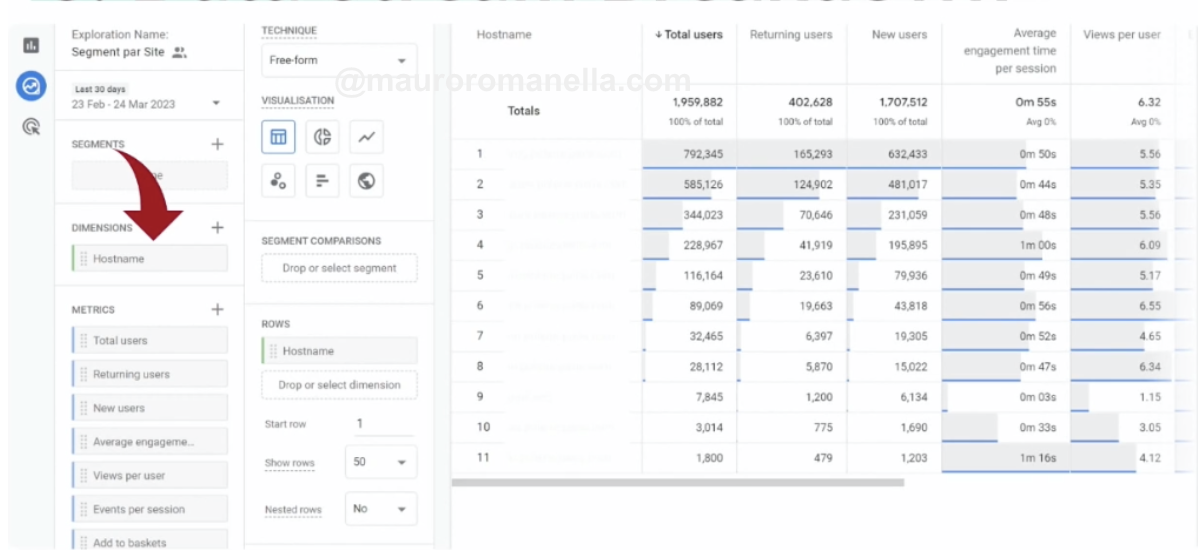
You create an exploration using your hostname as a dimension and track the overall user count, conversions, engagement, and other relevant metrics across all your different domains.
9. Scroll Tracking #
Which Insights provide this report?
How far down the people actually scroll the page.
How to set this report up
GA4’s default scroll tracking report only displays the 90% threshold and omits any intermediate data, providing no additional insights.
We can create an effective scroll tracking report that reveals whether visitors have engaged with the content to varying degrees, such as going a quarter or halfway through, which is particularly useful for longer pages.
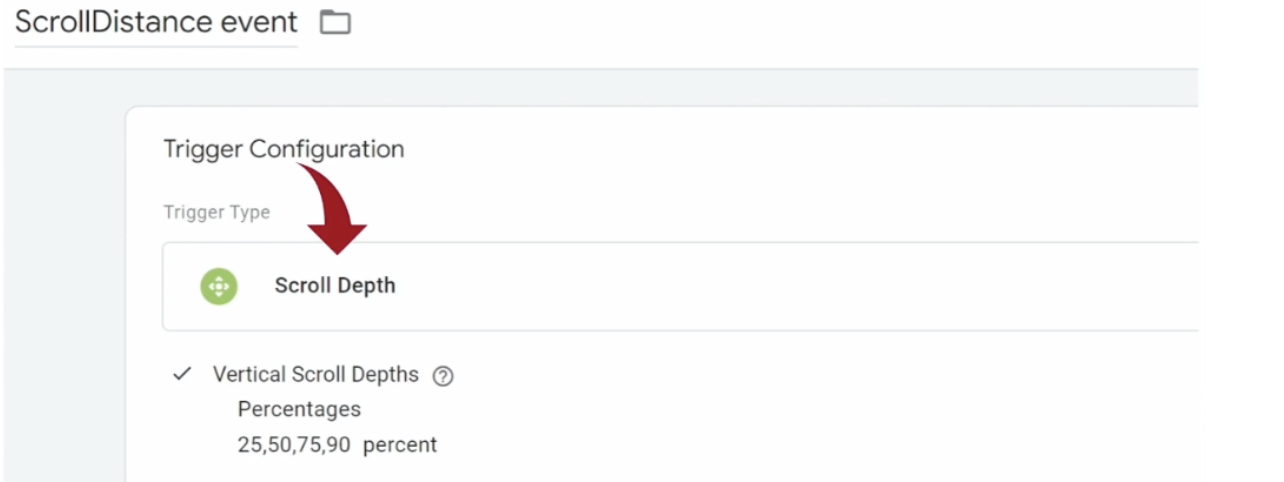
In Google Tag Manager, we can set up a trigger based on scroll depth by adding percentages, such as 25, 50, 75, and 90. It’s advisable not to use 100% since it often doesn’t register accurately, even when visitors have scrolled almost to the bottom of the page.
Next, we set up a Tag in GTM that sends an event named “scroll.” It’s important to use the term “scroll” as this is what GA4 recognizes and processes correctly.
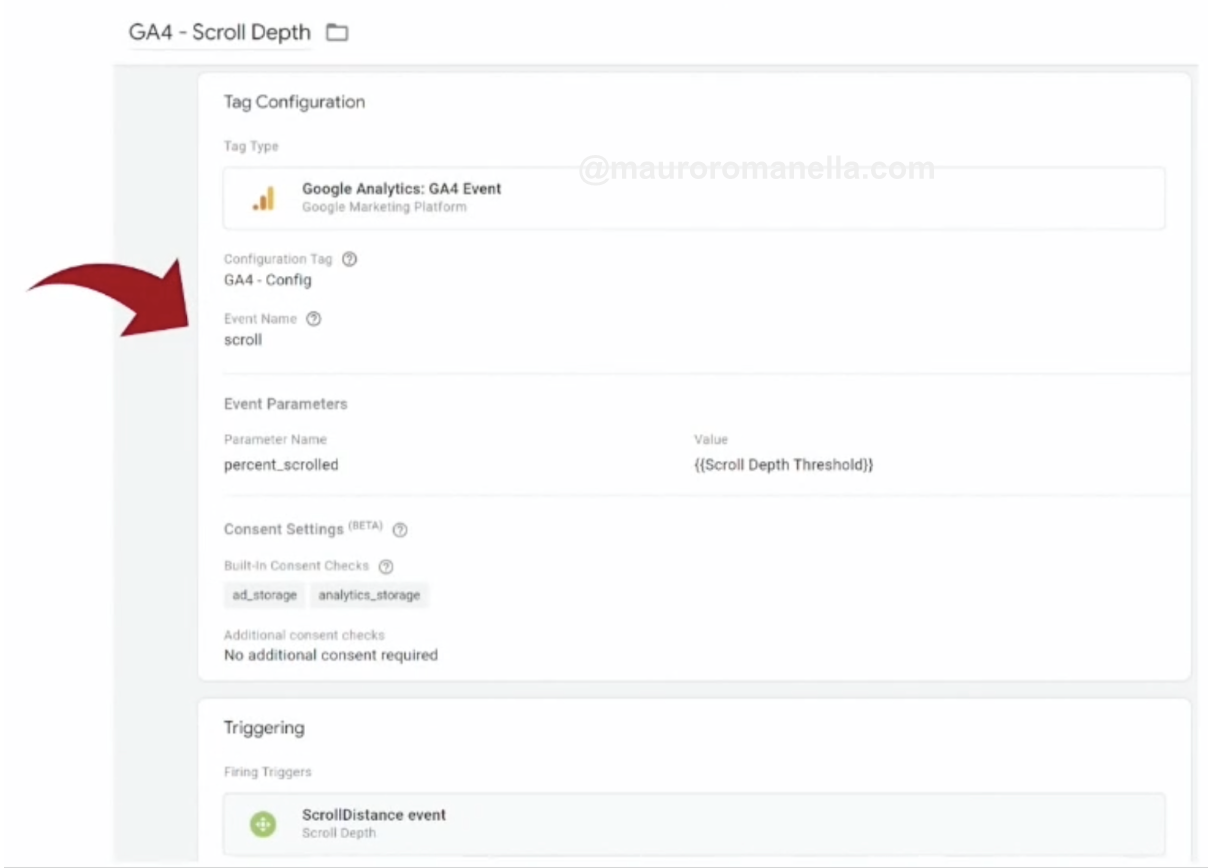
In the Tag, we also include a parameter called “percent_scroll” (again, be mindful of the name). The value of this parameter corresponds to the “{{scroll depth threshold}}” values that we set up previously in the scroll trigger.
Now in GA4, we can generate an exploration report using “percent Scrolled” as the dimension and applying a filter with the condition “event name = scroll”.
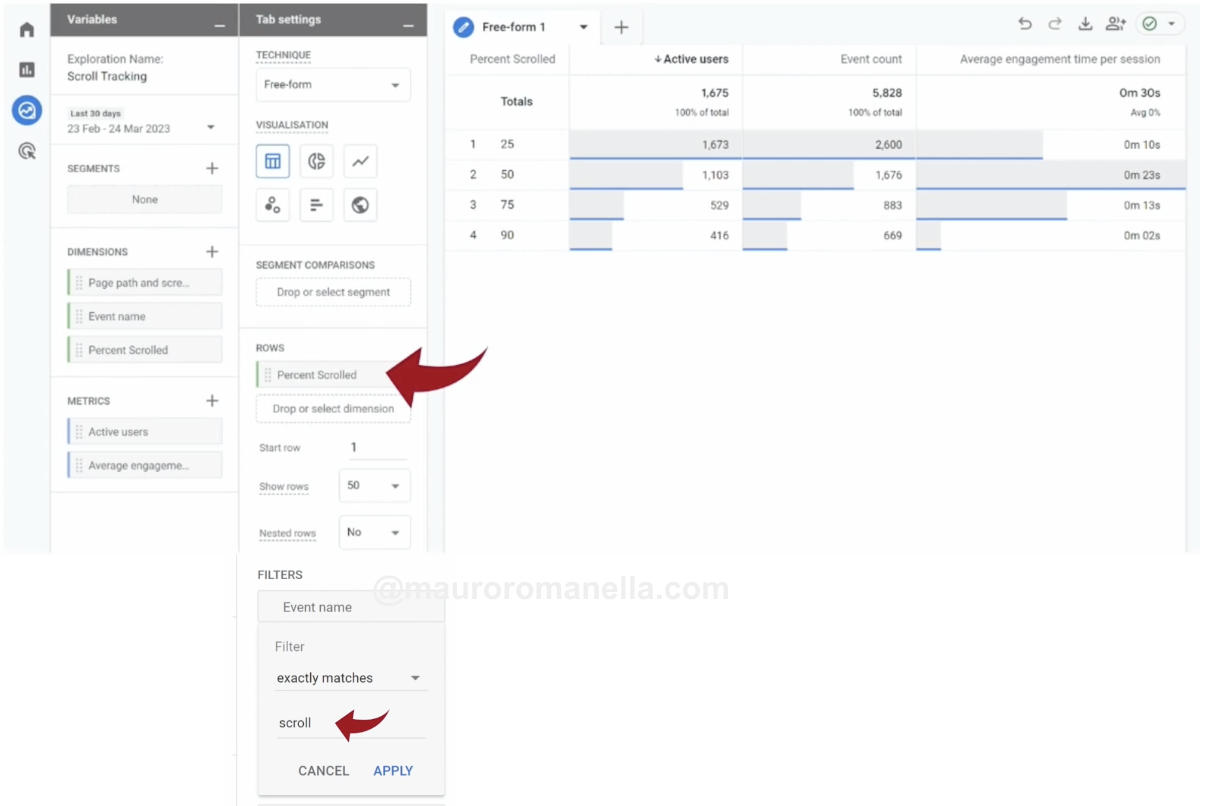
You can also create a filter based on “page name” to see the scroll of a specific landing page.
10. Content Stickiness #
Which Insights provide this report?
What this report aims to do is to reveal whether the excellent content pages and keyword-optimised landing pages you create are genuinely benefiting your website, not only in terms of sales but also in raising awareness and fostering consideration.
How to set this report up
In Exploration, create a segment, I called “info landing pages”, and add the dimensions “page path + query string”.
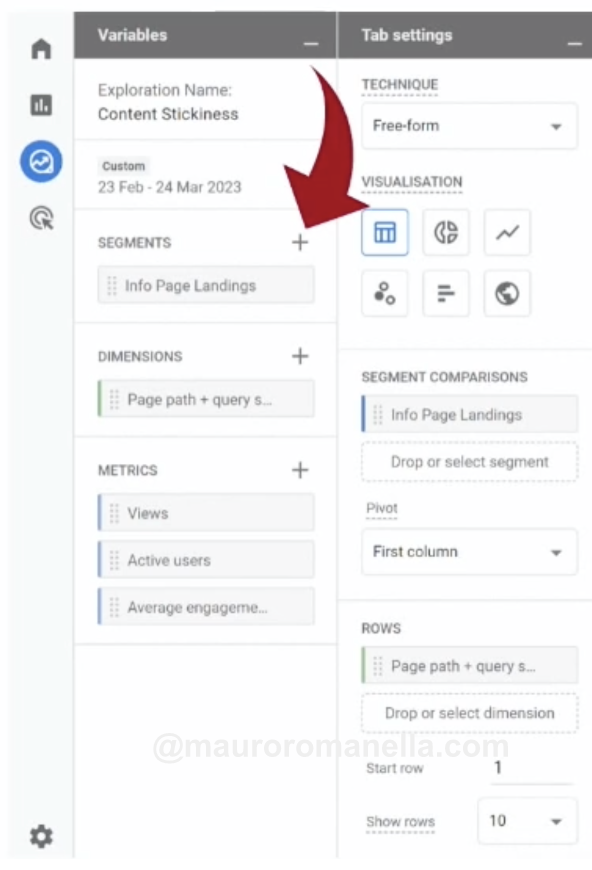
The segment “Info landing pages” in your website could be under /blog, /article, or any other sections where you have crafted content-rich pages to attract organic clicks or serve as landing pages for paid media. So, create a segment based on visitors who landed on these pages.
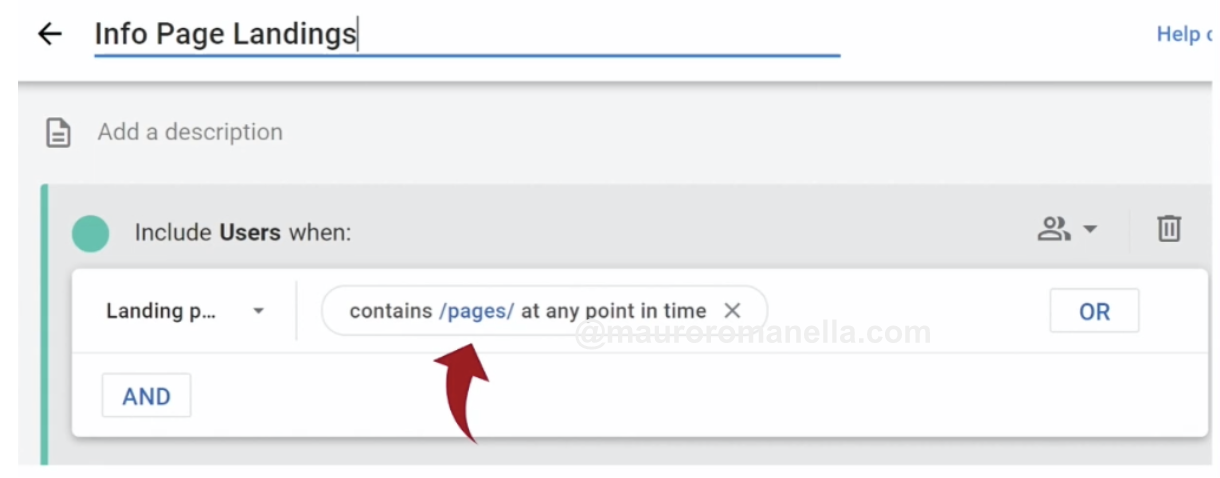
Ensure that the URL path, whether general or specific, reflects not just a particular instance when viewing the report but also captures any point in the user’s journey throughout your website.
When you apply the segment for “info landing pages” and examine the dimension “page path + query string,” you can see the views of active users and their average engagement duration.
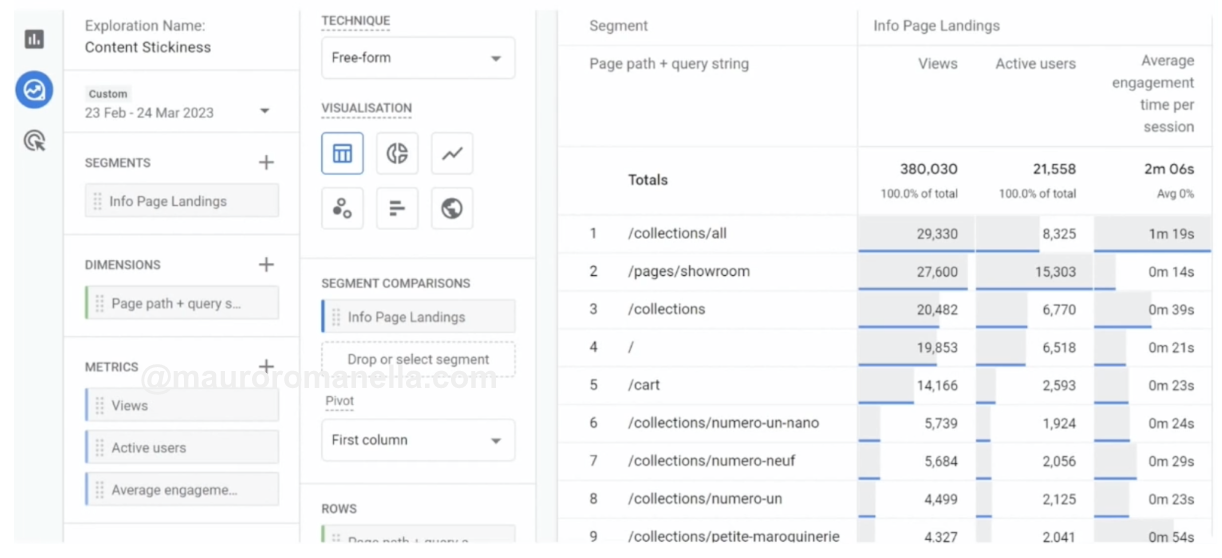
So, this report will reveal which pages visitors typically navigate to after landing on the initial page. If the report appears relatively empty, it indicates that users are arriving at the page and immediately leaving, rather than scrolling through and exploring the rest of your website.
This scenario frequently occurs with blogs, where visitors access the /blog section and only view other related posts, without actually exploring the revenue-generating pages such as service, product, or other key sections of your website.
