This article will guide you through the process of reporting on page speed optimisation, focusing on the key metrics and their impact on user experience, engagement, conversion rate and search engine optimisation (SEO).
Intro #
The speed of a webpage directly impacts the user experience and cascades into several indirect benefits.
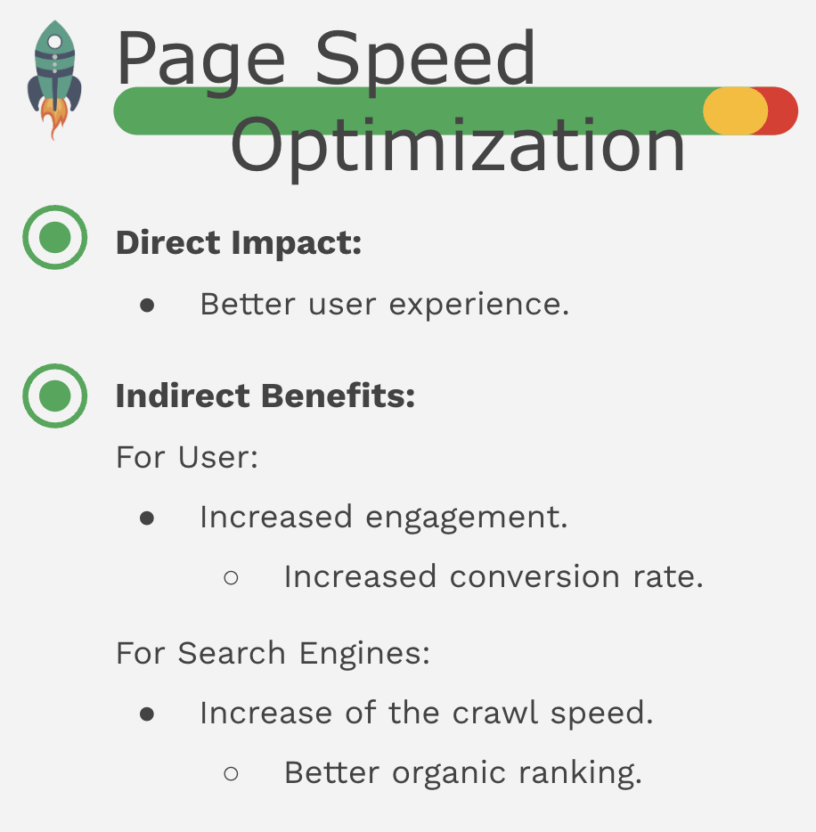
When a site loads quickly, it provides a better user experience, which is the primary direct impact of improved speed.
This enhancement in user experience leads to benefits for both users and search engines.
For Users:
- Faster sites lead to increased engagement, as visitors are more likely to interact with and explore a responsive website.
Visitors have a patience threshold. … unnecessary waiting will make them want to leave.
- This increased engagement often translates to higher conversion rates, with users more inclined to complete desired actions on a speedy site.
For Search Engines:
- Improved speed allows for an increase in crawl speed, enabling search engine bots to index more pages more efficiently.
- This increased crawl efficiency, combined with the positive user signals from better engagement, often results in better organic rankings for the website in search engine results pages.
Let’s see how we can report on each of these points and which metrics can be used to assess the website speed performance.
Report on User Experience #
To assess website speed performance, Google has identified three key metrics crucial for a good user experience:
-
Largest Contentful Paint (LCP):
- Measures loading performance.
- The target for LCP is 2.5 seconds or less.
-
First Input Delay (FID):
- Measures interactivity.
- The target for FID is 100 milliseconds or less.
-
Cumulative Layout Shift (CLS):
- Measures visual stability.
- The target for CLS is 0.1 seconds or less.
The metrics listed above are known as Core Web Vitals and show how your pages perform, based on real-world usage data.
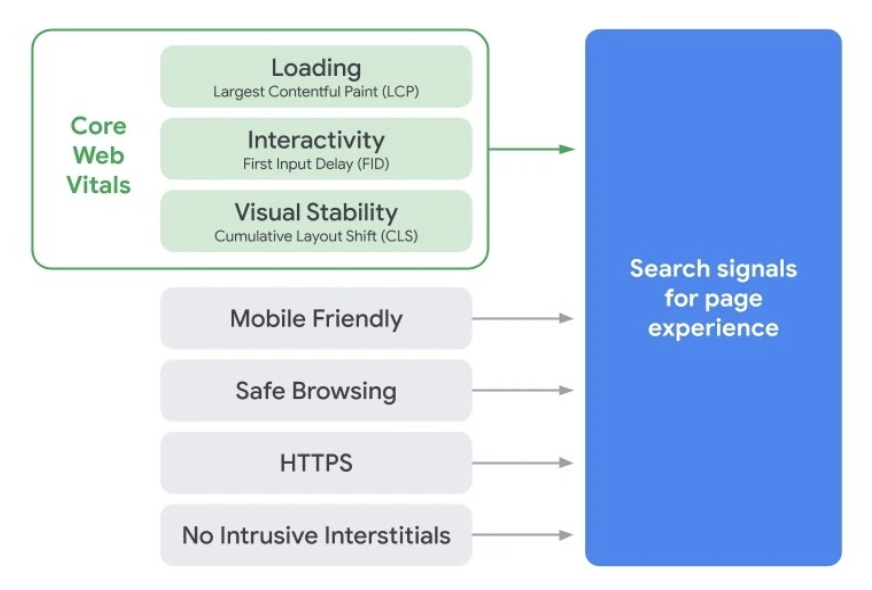
There are several tools out there that can be used to analyse these metrics:
- Google Search Console: Offers a dedicated Core Web Vitals report under the “Enhancements” section.

- Microsoft Clarity: Has a performance widget that provides a score based on the LCP, FID, and CLS metrics.

- Chrome User Experience (CrUX): Using the Looker Studio CrUX Dashboard for visualising data.

🤔 If you are wondering …
Why do different tools report different core web vitals?
In short, different tools report different Core Web Vitals values due to variations in testing conditions, data collection methods, and user demographics.
The most reliable data comes from real user monitoring (RUM) solutions and Google’s CrUX data.
🤔 If you are wondering …
Where are GA4 speed metrics?
Google Analytics 4 (GA4) does not provide dedicated speed metrics by default. This means it lacks the built-in features to directly measure page load times and other performance indicators.
However, you can still track these metrics using custom event tracking.
Data is only collected after you’ve implemented the page load time tracking solution. This means that historical data won’t be available if you haven’t already implemented the page load time tracking solution.
To demonstrate improvements, use a table showing the percentage of improvement and the eventual achievement of the target.
Here’s how our website’s Core Web Vitals metrics after the optimization process:
|
Metric |
Before Optimization |
After Optimization |
Improvement |
Target |
|---|---|---|---|---|
| Largest Contentful Paint (LCP) | 5.2 seconds | 2.1 seconds | 60% | <= 2.5 seconds |
| First Input Delay (FID) | 180 milliseconds | 45 milliseconds | 75% | <= 100 milliseconds |
| Cumulative Layout Shift (CLS) | 0.35 | 0.02 | 94% | <= 0.1 |
As shown in Table, website optimization resulted in significant improvements in all Core Web Vitals metrics.
Loading (LCP) decreased by 60%, from 5.2 seconds to 2.1 seconds.
Interactivity (FID) saw a 75% improvement, dropping from 180 milliseconds to 45 milliseconds.
Visual stability (CLS) also improved dramatically, with a 94% reduction from 0.35 to 0.02.
Report on Website Engagement #
Google Analytics 4 introduced new metrics that offer a more accurate way to capture session engagement, replacing the traditional bounce rate.
Note:
The traditional bounce rate metric is still available in Google Analytics 4 (GA4), but it’s a bit hidden due to its decreasing relevance.
However, in certain contexts, such as a quick assessment of a website’s overall performance after page speed optimisation, the bounce rate can still provide a general indication of user engagement. It’s important to remember that the bounce rate doesn’t capture the full spectrum of user behavior, especially in the context of modern websites with interactive elements and longer session durations.
In Google Analytics, a session is defined as engaged if it meets at least one of the following criteria:
- Lasts 10 seconds or longer
- Indicating the user spent a reasonable amount of time interacting with your content.
- Has at least two pageviews
- Suggesting the user explored your site beyond the initial landing page.
- Has at least one conversion event
- Showing the user took a desired action.
Key engagement metrics to report on include:
- Engaged Sessions: Number of engaged sessions.
- Engagement Rate: Engaged sessions divided by total sessions.
- Engaged Sessions Per User: Engaged sessions divided by total users.
- Average Engagement Time: User engagement duration.
- Average Engagement Time Per Session: Session engagement duration.
To find engagement metrics in GA4, navigate to:
- Life cycle collections > Engagement > Overview report
- Life cycle collections > Acquisition > User Acquisition report
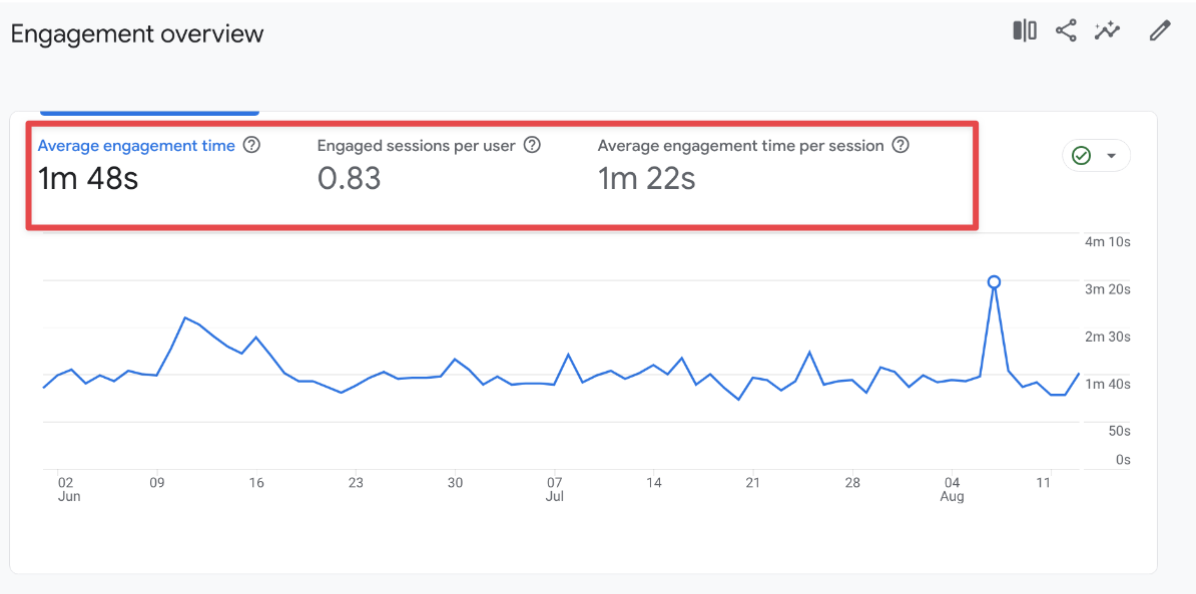

The User Acquisition report shows the default channel grouping associated with a user’s first session that generated the most engagement.
Here’s how our website’s user engagement metrics after the optimisation process:
|
Metric |
Before Optimization |
After Optimization |
Improvement |
|---|---|---|---|
| Engaged Sessions | 1,000 | 2,500 | 150% |
| Engagement Rate | 25% | 50% | 100% |
| Engaged Sessions Per User | 1.5 | 2.2 | 47% |
| Average Engagement Time | 1 minute 15 seconds | 2 minutes 30 seconds | 100% |
| Average Engagement Time Per Session | 1 minute 15 seconds | 2 minutes 30 seconds | 100% |
The table shows a positive correlation between improved website speed and user engagement.
The number of engaged sessions increased by 150% from 1,000 to 2,500.
The engagement rate doubled from 25% to 50%.
Users had 47% more engaged sessions per user, increasing from 1.5 to 2.2.
Average engagement time increased by 100%, from 1 minute 15 seconds to 2 minutes 30 seconds.
Report on Website Conversion Rate #
Conversion rate is a critical metric that measures the percentage of visitors who complete a desired action on your website.
In Google Analytics, user’s actions on a website or app are tracked as events, and the actions that you mark as particularly important for your business are called “key events”.
Event metrics to report on include:
- Event Count: The number of times users triggered an event.
- Key Events: The number of times your users triggered a key event.
- User Key Event Rate: The percentage of users who triggered any key event.
To find event metrics in GA4, navigate to:
- Life cycle collections > Engagement > Event report

Here, you can see your events over time, categorised by ‘event_name’ and broken down across four metrics:
- Event Count: Which events are most common.
- Total Users: How many users performed each event.
- Event Count Per User: Average number of events per user.
- Revenue: How much revenue is associated with each action.
- Life cycle collections > Acquisition > User Acquisition report
Here you will be able to see the default channel grouping associated with a user’s first session that generated the most events.

By default, all events are shown. Use the filter to focus on specific events.
Here’s how our website’s conversion rates were affected by the website speed optimisation:
|
Metric |
Before Optimization |
After Optimization |
Improvement |
|---|---|---|---|
| Conversion Rate (Overall) | 2.5% | 4.2% | 68% |
| Event Conversion Rate (Key Event) | 1.8% | 3.1% | 72% |
As seen in table, there was a significant improvement in both overall conversion rate and event conversion rate after website optimisation.
- The overall conversion rate increased by 68%, from 2.5% to 4.2%.
- The event conversion rate, which tracks a specific desired action, also saw a 72% improvement.
Report on Crawl Speed #
When pages load quickly, search engine bots (like Googlebot) can scan content more efficiently, potentially leading to:
- Faster Discovery of New Pages: If you add a new page or blog post, search engine bots find it sooner.
- Quicker Index Updates: If you make changes to an existing page, search engine bots revisit it sooner.
An improved website speed would have a direct impact on the following metric:
- Average Response Time (ms): This metric measures how long it takes for your server to respond to a crawl request from Googlebot.
The metric is available in Google Search Console under Settings > Crawling > Crawl stats report.

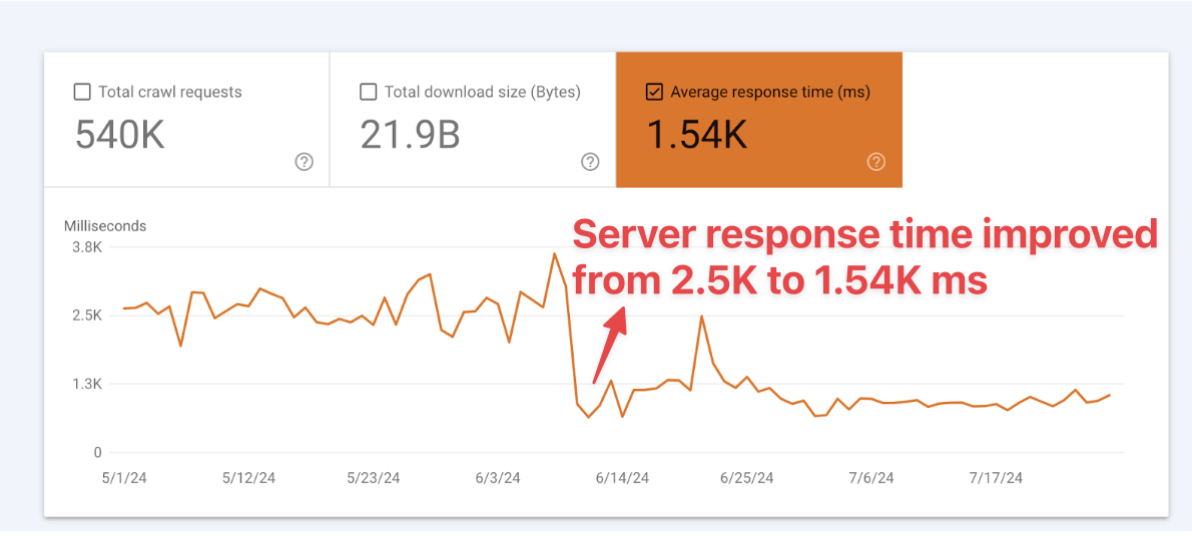
Tick only the Average Response Time metric. The other metrics, total number of crawl requests, and total download size, are not directly impacted by website speed.
Here’s how our website’s crawl speed changed after optimisation:
|
Metric |
Before Optimization |
After Optimization |
Improvement |
|---|---|---|---|
| Average Response Time (Google Search Console) | 850 milliseconds | 420 milliseconds | 51% |
The table shows that website optimisation led to a 51% improvement in average response time according to Google Search Console data.
Report on Ranking #
Google considers page speed as a ranking factor for both desktop and mobile searches.
In 2018, Google announced that loading speed would become a significant landing page factor for Google Ads. This means that websites with faster loading times are more likely to rank higher in both search results and ad auctions, leading to increased visibility, organic traffic, and more impressions.
For more details on how Google uses speed in Search Ads, you can refer to this blog post from the Chrome Developers team.
The key metric to assess ranking performance include:
- Query Position: Position of your site for a specific query.
- Average Position: Average position of your site for queries.
These metrics are available in Google Search Console under Performance Report.
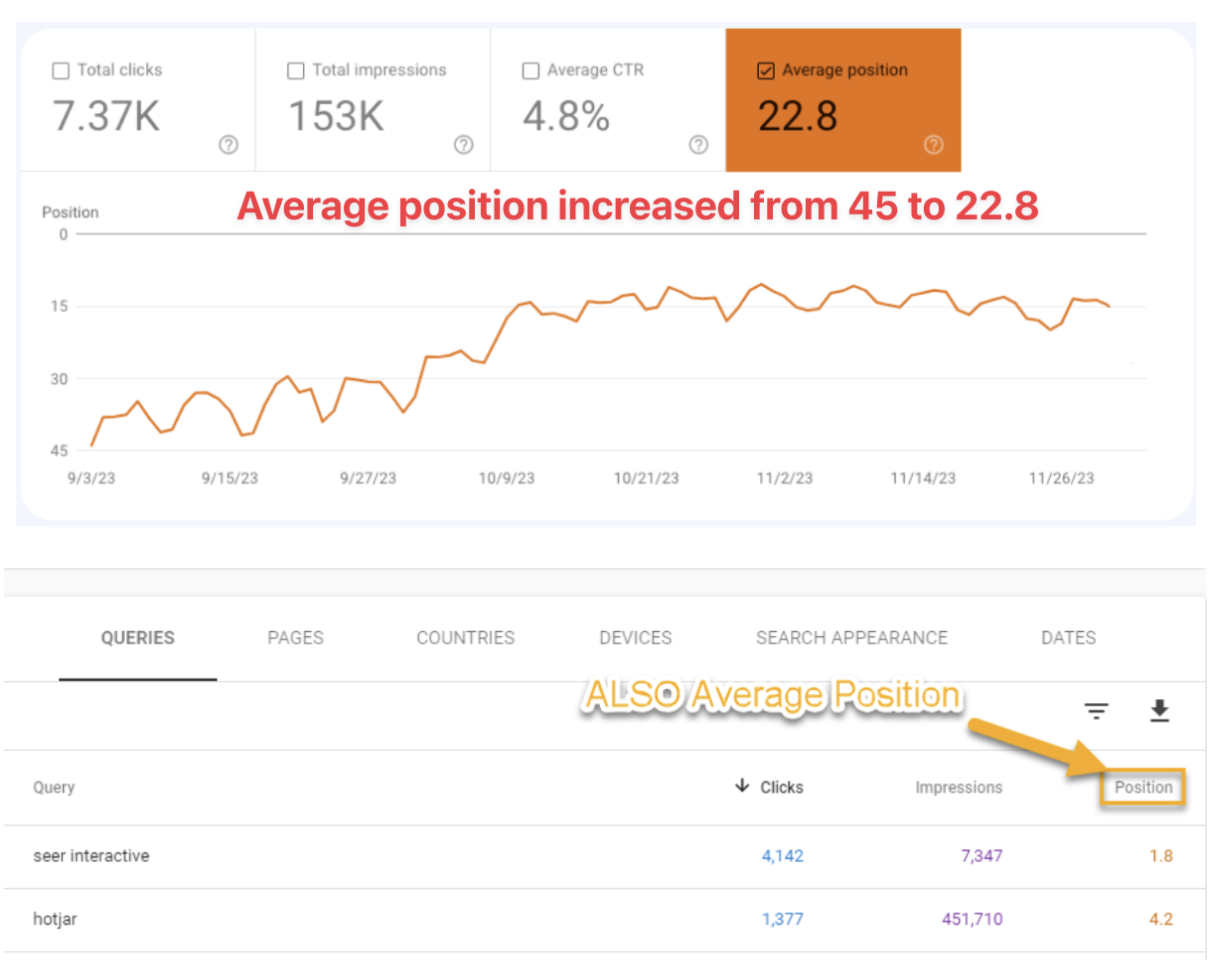
The report provides an overview of average positions for all keywords, while the performance table offers a detailed breakdown for individual keywords.
I have written up a deep-dive all about the performance report if you want to learn more.
Here’s how our website’s ranking metrics changed after optimisation:
|
Metric |
Before Optimization |
After Optimization |
Improvement |
|---|---|---|---|
| Average Response Time (Google Search Console) | 48 | 32 | 33% |
The significant improvement in average position from 48 to 32.
It’s important to note that other factors also influence search rankings, and further investigation is required to isolate the specific impact of speed.
