In the tutorial, we will take a look at the attribution models used by Google Analytics.
In an ideal world, we would want our visitors to click on one of our ads or blog posts and convert into a lead almost instantly.
In the real world, the purchase made on a website is the result of a buyer’s journey during which there are a sequence of interactions with your website that take place within a given time frame.
In Google Analytics, an interaction (also known as ‘touchpoint’ or just ‘touch’) is an exposure to a marketing channel, while, the sequence of interactions that lead a customer to conversion, is called conversion path.
In a conversion path, channels can have three roles:
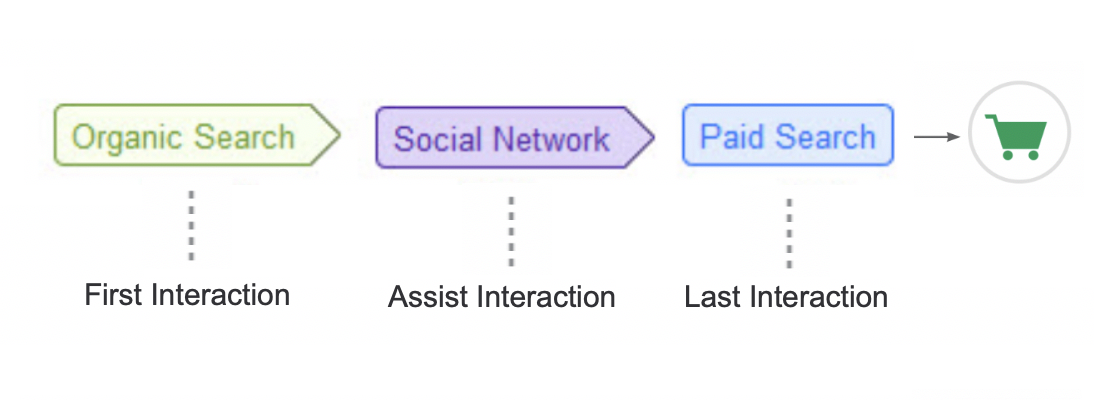
First Interaction: First referral (or initiator) on the conversion path.
Assist Interaction: Any non-last referral on the conversion path.
Last Interaction: Immediately preceding the conversion referral.

Let’s look at an example of conversion path that involved many channels.
Kate wants to buy a chair for her home office.
-
Interaction 1 (Organic Search)
Kate Googles “comfortable office chair,” looks at some pages on yourofficechairs.com, and leaves.
3 days later,
Interaction 2 (Social Network)
Kate sees an article on Facebook that mentions how comfortable your chairs are. She clicks the link to yourofficechairs.com and looks at the recommended chairs.
7 days later,
Interaction 3 (Paid Search)
Kate Googles “chairs for home office” and sees your ad. She clicks it and completes the purchase.
The conversion path would look like this:
The example above raises three kinds of analysis:
Conversion Paths
Channel Interactions
Attribution Model
How many interactions lead to conversion?
How long takes to conversion?
Which channel interaction is most responsible for nudging the user to convert?
Which of these marketing channels should the conversion be attributed to?
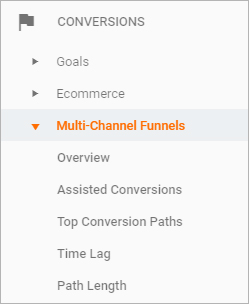
We can answer to these questions using the Multi-Channel Funnels reports in Google analytics, under the Conversions menu.
How many interactions lead to conversion? #
There are two report within the Multi-Channel Funnels that help you to answer this question:
Path Length
Top Conversion Paths
The Path Length Report tell you how many interactions with your site leads to a conversion.
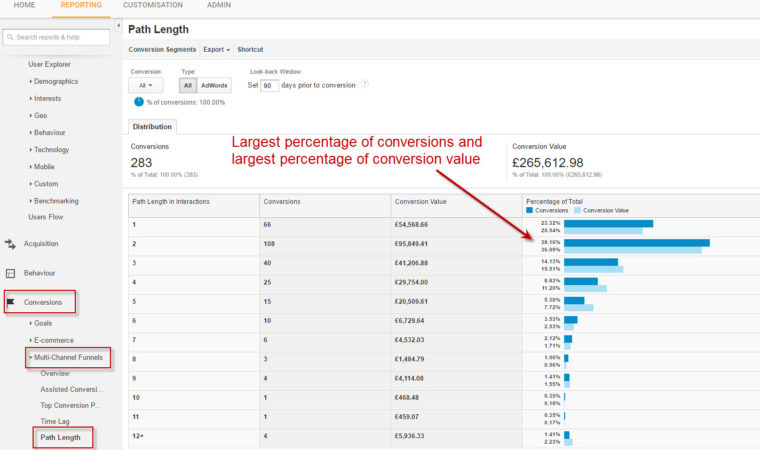
Looking at the picture above, we can see that 28% of all conversions occurred after more than one channel interaction, also, 57% of all conversion value occurred after more than one interaction.
Now you know how many interactions you need to have with a visitor before they convert. But which channel comes first (“introduces our brand to the customer”), which channel comes second (“nurtures our potential customer”), which channel comes fourth, fifth … and last. You can use the Top Conversion Paths report.
If it takes many interactions to convert on your site, it important to determine how many channels it takes to convert. You can use the Top Conversion Paths report.
The Top Conversion Paths report give you a list of every combination of channel interactions that led to a conversion.
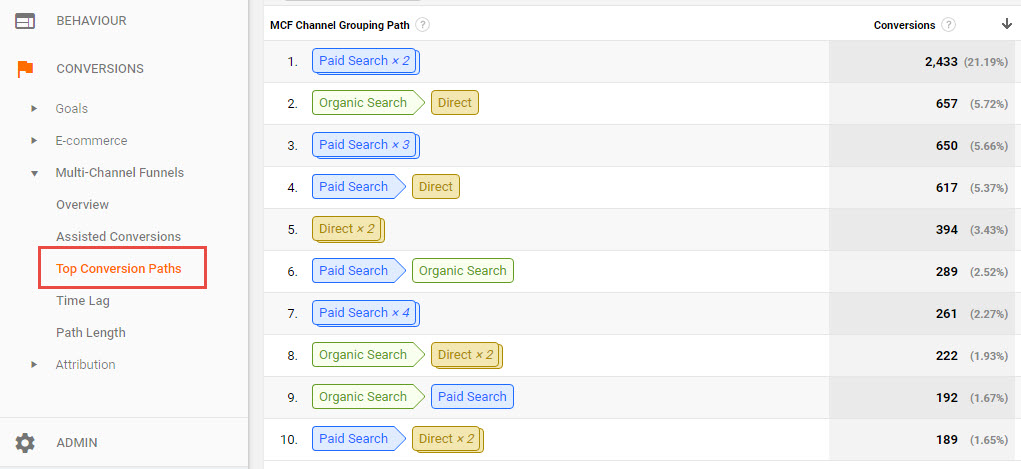
Most likely, the paths will be very diverse: 3%-5% of visitors followed the top path. But there are still actionable trends you can obtain from this report.
Start off by identifying the ideal conversion paths through which users are converting most.
We can take the data here a step further and look at which “Source Path” are assisting the conversions by using filters to drill into the data.
From the Top Conversion Path report, add a secondary dimension for “Source Path.”
source: https://searchengineland.com/drilling-into-top-conversion-paths-for-valuable-insights-150383

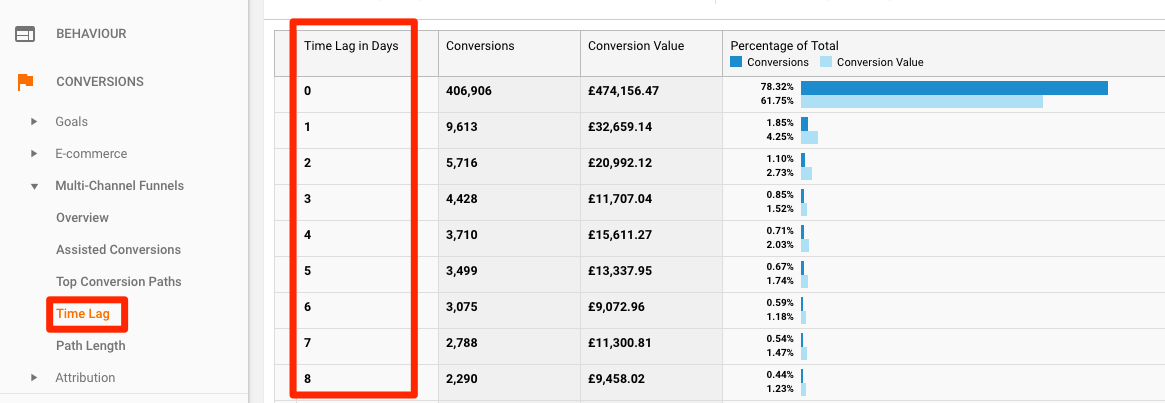
The next step to analyse the conversion path is to see how long your customers takes to convert. You can use the Time Log report.
Which channel interaction was most responsible for nudging the user to convert? #
The Venn diagram in the muti-channel visualizer report give you on the overview of how the various channels interact with each other.
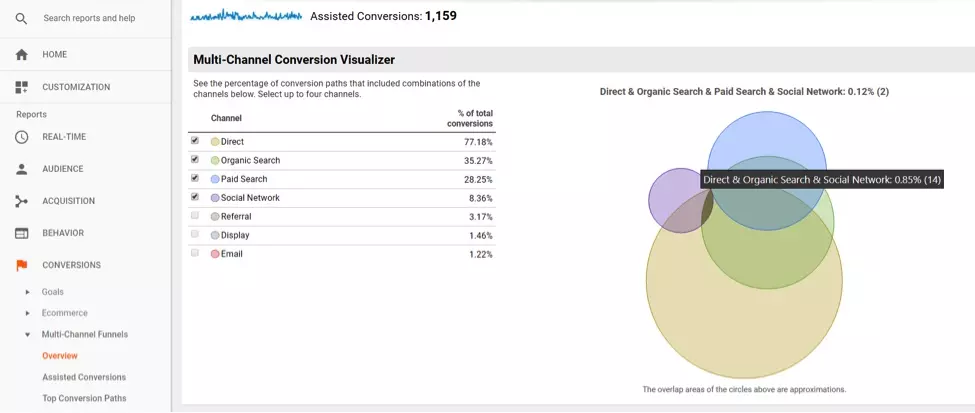
But let’s get more details about various channel interactions and see where they fall in the funnel. That’s the job of the Assisted Conversions report.

Look at the last column: “Assisted/Last Click or Direct Conversions”. I like what Justin Cutroni calls it: the “Exposer to Closer Ratio”.
This metric tells you which traffic sources are Exposers, meaning they spread your brand message, and which ones are Closers, meaning they get people to convert.
“A value close to 0 indicates that this channel functioned primarily as the final conversion interaction. A value close to 1 indicates that this channel functioned equally in an assist role and as the final conversion interaction. The more this value exceeds 1, the more this channel functioned in an assist role.” – Brian Clifton in Advanced Web Metric

Who gets the credit for any revenue created? #
Well, that will depend on the attribution model.
Attribution may sound complicated but in simple terms, comes down to assigning credit of each consumer interaction that led to the conversion.
“Attribution means dividing the value of an online sale (or conversion) and distributing fractions of that value across the different interactions that led to the sale.” – ThinkwithGoogle, in measure-what-matters-most

There is a tool inside the Multi-Channel Funnels called Model Comparison Tool.
To understand how to use this tool need you have a basic understanding of the difference between the attribution models and the limitations of each of these.
Let’s have a look at the most commonly attribution models using the below conversion path as a reference.

-
1. First Interaction/Click
All the credit for a conversion goes to the first interaction.


-
2. Last Interaction/Click
All the credit goes to the last interaction.


-
3. Linear
Conversion is attributed equally to all the interactions.


-
4. Time decay
Recent interactions are given more credit than older ones.


-
5. Position Based
Credits are given based on the specific position of the interactions.


Google Analytics uses, in all of its reports, the last click attribution model with an important exception: If the last interaction is ‘direct’, GA remembers the previous interaction and attributes all the credit to that.
In our example this model would say all credit goes to Paid.

But is that right? There are various channels involved in conversion without which conversion would not have taken place.
That’s where the Model Comparison Tool comes in so handy!
The Model Comparison Tool allows you to compare the attribution models and see how they impact the valuation of your marketing channels.
For example, what if we used a time decay attribution model instead of last click?
Essentially, we’re splitting up the revenue of the orders among the touch points that lead to the conversion, and rewarding the channels differently based on the model.
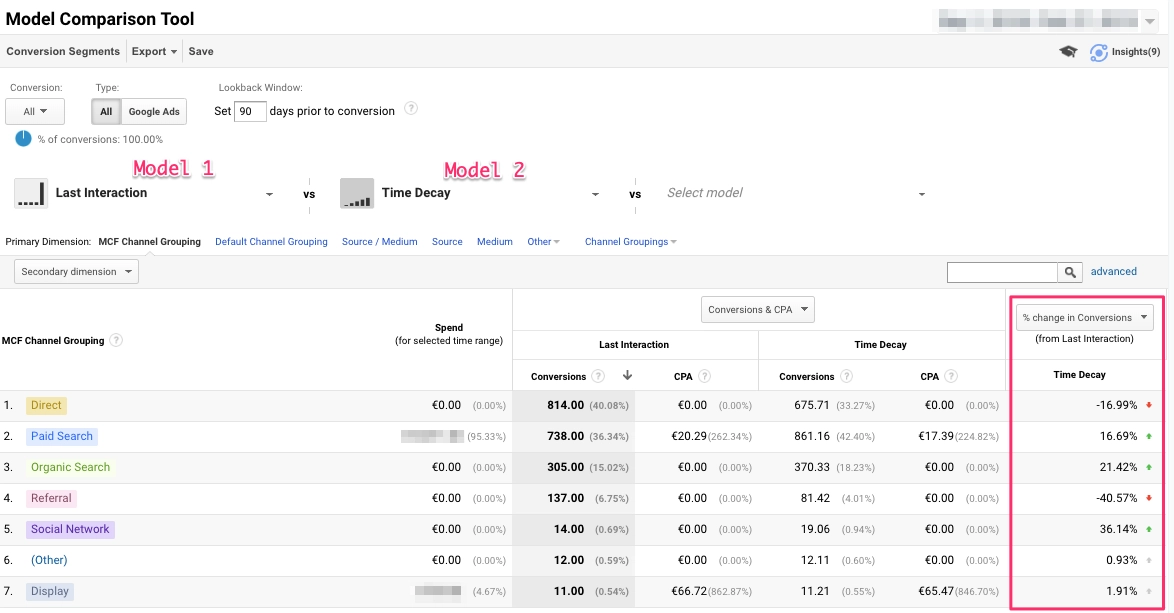
Look at the last column called ‘% change in conversion (from last interaction)’, we see a 16.7% increase in conversions for Paid Search if we consider the time decay model compared to the last click attribution model.
In other words, ‘Paid Search’ is undervalued under the last-click attribution model (when this model is compared with the ‘data-driven’ attribution model).

This is my first time pay a quick visit at here and i am in fact pleassant to read all at one place.
I cannot thank you enough for the article.Much thanks again. Will read on…
Thanks-a-mundo for the article post. Want more.
Im obliged for the post.Much thanks again. Much obliged.
I appreciate you sharing this blog post.Really thank you! Awesome.
A round of applause for your blog post. Want more.
Really enjoyed this blog.Really thank you! Cool.
Really enjoyed this article post. Really Great.
Hey, thanks for the blog.Really looking forward to read more. Fantastic.
Appreciate you sharing, great blog. Great.
wow, awesome blog article.Really thank you! Great.
Thank you for your blog post.Really looking forward to read more. Really Cool.
Very neat blog post.Thanks Again. Will read on…
I really liked your blog post. Want more.
Looking forward to reading more. Great blog post.Really looking forward to read more. Great.
Enjoyed every bit of your blog.Much thanks again. Will read on…