In this tutorial, we will take a look at the attribution paths report, formerly called "Conversion paths", which is part of the Attribution reports of GA4 Advertising. The focus will be on understanding the key concepts and settings required to conduct a thorough analysis of conversion paths.
Update Apr 2023: Google Analytics has updated terminology over time, and what was previously referred to as the “conversion path” is now known as “attribution paths”.
The term “attribution paths” reflects a shift in focus. It’s not just about the path users take, but how credit for conversions is assigned to different touchpoints along the way.
Note: The conversion paths report of Google Analytics 4 (GA4) substitutes the Multi-Channel Funnels reports previously available in Google Universal Analytics (GA3).
What is … #
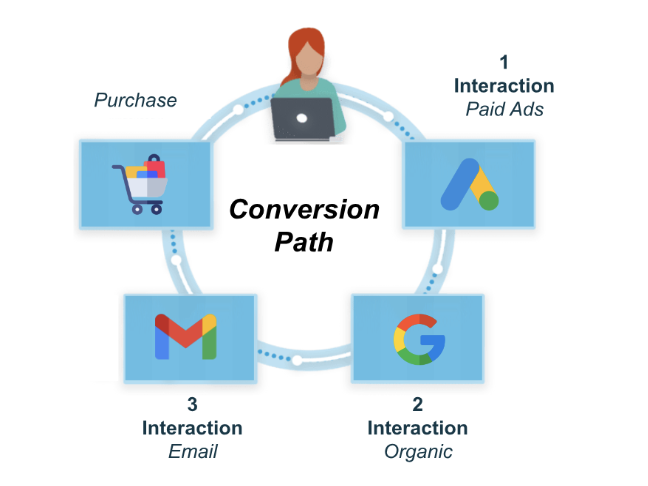
Typically, the purchase made on a website is the result of a buyer’s journey during which there are a sequence of touchpoint(s) with your website within a given time frame.
In Google Analytics, a touchpoint (also known as “interaction” —with your brand) is an exposure to a marketing channel, while, the sequence of touchpoint(s) that lead a customer to conversion, is called conversion path.

Read more about: identify and tracking conversion events in GA4.
Why is it important … #
This report is a central place for you to analyse top paths, time lag to conversion, and path length to conversion.
As the name suggests, the conversion path report provides insight into the path that leads to conversion.
In general, knowing the customer’s journey before converting helps identify the key areas along the path to focus on to increase and accelerate conversions.
Specifically, through the analysis of the conversion path report, you can find answers to the following questions:
Which traffic channels drive the highest or lowest number of conversions and revenue?
What are the touchpoints customers go through before converting?
How do different attribution models compare?
Which specific “campaigns” have the highest or least impact on conversions?
How many interactions lead to conversion?
How long takes to conversion?
Where is … #
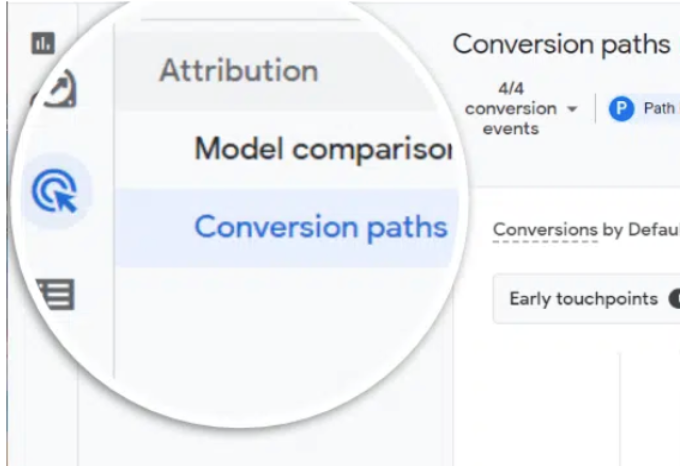
The conversion paths feature is included in the Attribution reports of GA4 Advertising.
To access the report go to: Advertising > Attribution > Attribution paths
How to use … #
Prerequisites #
You need to check three things:
Make sure that your GA4 property has at least one conversion event. This is required to use the Conversion Paths report.
Make sure, if you are using Google Ads, to link your GA4 property with your Google Ads account
Make sure that all your marketing campaigns have the UTM tracking applied.
Interface #
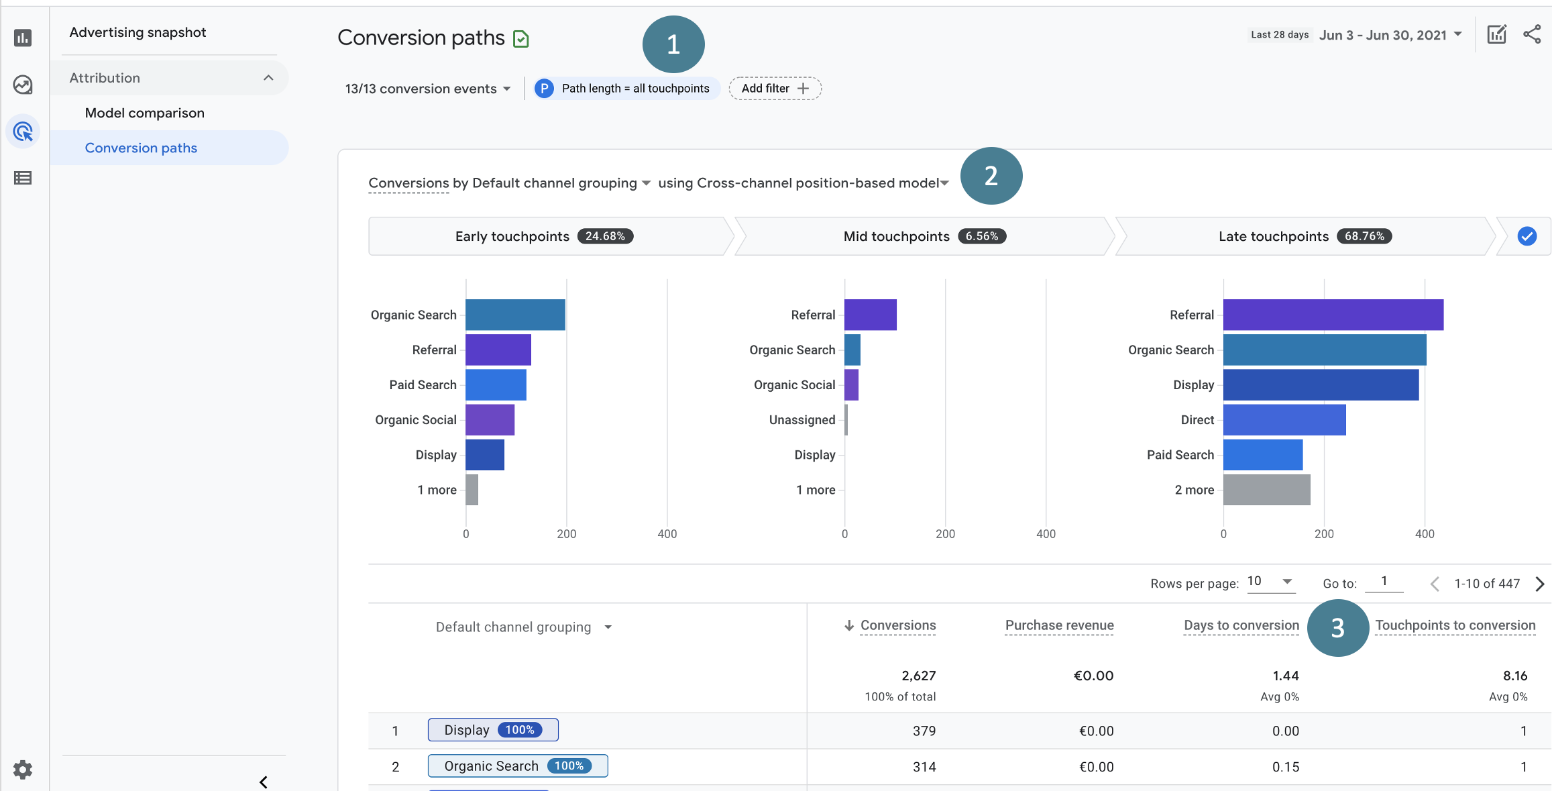
The Conversion Paths Report is made up of three sections:
- Selections and filter
- Data visualisation
- Data table
Selections and filter #
The default view of the conversion path report, for the selected data range, shows:
- All the conversion events (they’re aggregated together in the report).
- From all users.
- Include all TouchPoints.
- The conversions are broken out by the Default channel group dimension.
- Using the Data-driven (Paid and organic channels) attribution model.
However, we can use the drop-down menus at the top to view the data in various ways.
This includes selecting a specific conversion event, applying filters for a particular set of users, adjusting the path length, segmenting the conversion by Source, Medium, or Campaign dimensions, and even using a different attribution model (Cross-channel non-direct or Ads preferred last click).

Attribution Paths report setup recommendations:
I recommend picking a single specific conversion event (such as a ‘purchase’ for an e-commerce site) and selecting a data range of at least 30 days to make the data analysis statistically significant. Remember that, the more conversions on your website or app, the more meaningful this report becomes. In a lot of cases, I prefer to work with Data-Driven attribution instead of the other two models. Also, consider the use of Filters to further segment the data, allowing for a more granular analysis.
The changes will be reflected in both the data visualisation and the data table
The data visualisation #
Undoubtedly, one of the features of the Conversion Path Report that catches the eye is the Touchpoint visualisation.
This feature allows you to check which of default channels (or other selected dimensions) have the biggest contributions on initiating (early touch points), supporting (mid touch points) and closing (late touch points) the conversion. It also shows how the attribution model selected distributes the credits along the path.
The touchpoints are defined as:
| Touchpoints | % of the Path | Notes |
|---|---|---|
| Early | The first 25% of touchpoints in the path. |
This segment is empty if the path has only one touchpoint. |
| Mid | The middle 50% of touchpoints in the path. |
If the path has <3 touchpoints, this segment is empty. |
| Late | The last 25% of touchpoints in the path. |
If the path consists of just one touchpoint, this segment gets all the conversion credit. |

By hovering over the header, you can view the conversion credit as well as the exact number of conversions.

By hovering over the dimensions, you can view the conversion credit associated with each touchpoint.
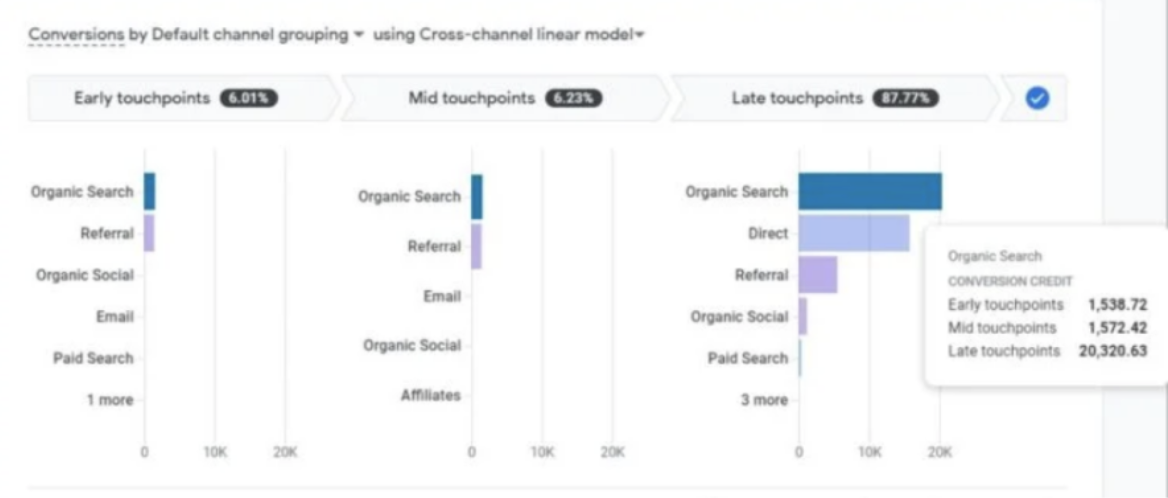

Balanced Contribution in Early and Mid Stages: Early and mid touchpoints contribute almost equally to conversions (6.01% and 6.23%, respectively). This suggests a relatively balanced influence of these stages in the customer journey.
Late Touchpoints are Most Influential: A significant majority (87.77%) of the conversion credit is attributed to late touchpoints. This indicates that the channels involved towards the end of the customer journey are the most influential in driving conversions.
Diversity of Channels: There is a variety of channels contributing to conversions at all stages, including Organic Search, Referral, Organic Social, Email, and Paid Search. This diversity indicates that a multi-channel approach is important for reaching potential customers at different stages.
Importance of Organic Search: Across all stages, Organic Search is a consistent contributor to conversions. However, its role becomes substantially more critical during the late touchpoints, as evidenced by the much higher conversion credit value (20,32) compared to the early and mid-stages.
Channel Effectiveness: The data may suggest that efforts in Organic Search should be maintained or even increased. It may also be effective to look into why Direct and Referral methods are so influential in the late stage and consider optimising these channels for better conversion rates.
Channel Optimisation: Marketers should consider investing more in the channels that appear in the late touchpoints, as they seem to be more decisive in converting leads into customers. They should also not neglect the early and mid touchpoints, as these create the foundational interest and engagement that leads to final conversions.
It’s worth noting that while this data provides valuable insights, it is also essential to understand the customer journey in more depth, as well as to consider other factors such as customer satisfaction, lifetime value, and retention, which are not depicted in this report.
The data table #
As for the data visualisation, the data table shows you the paths that lead the users to close conversion.
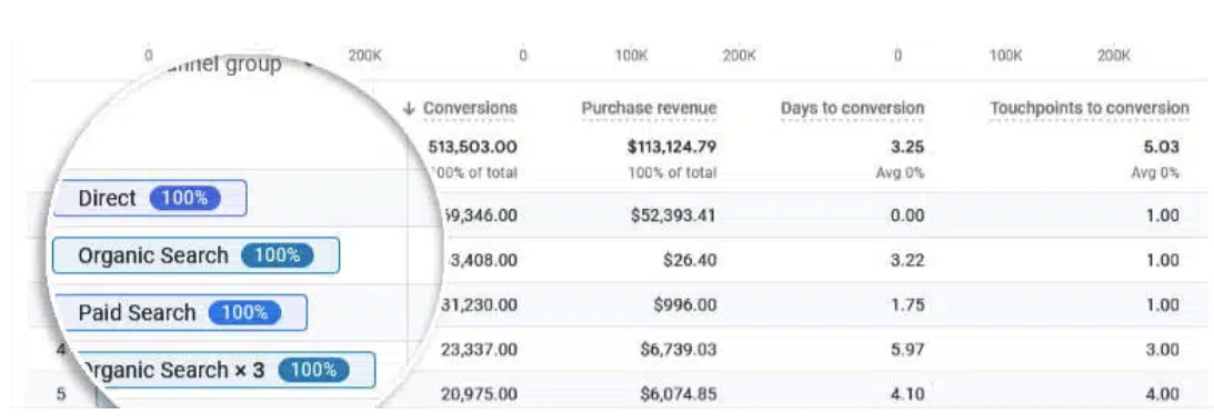
You may have noticed that each touchpoint is accompanied by the percentage of conversion credit assigned, along with a numerical value (such as “x2,” “x3,” “x4,” and so on) indicating the number of interactions with that specific channel.
The data table shows the conversions over time, broken down by default channels, across 4 metrics:
- Conversions: The number of conversion events.
- Purchase Revenue: The sum of purchases on your website or in your app.
- Days to Conversion: The time lag of the conversions.
- Touchpoints to Conversion: The path length of the conversions.
For the table we have the ability to:
- See the data using a different dimension.
- See more rows per page, from 10 to 250 max.
- Navigate through different row either by putting them in numerically or by clicking the arrow key.

Example #
To better understand the conversion paths report, let’s look at a single, example path.
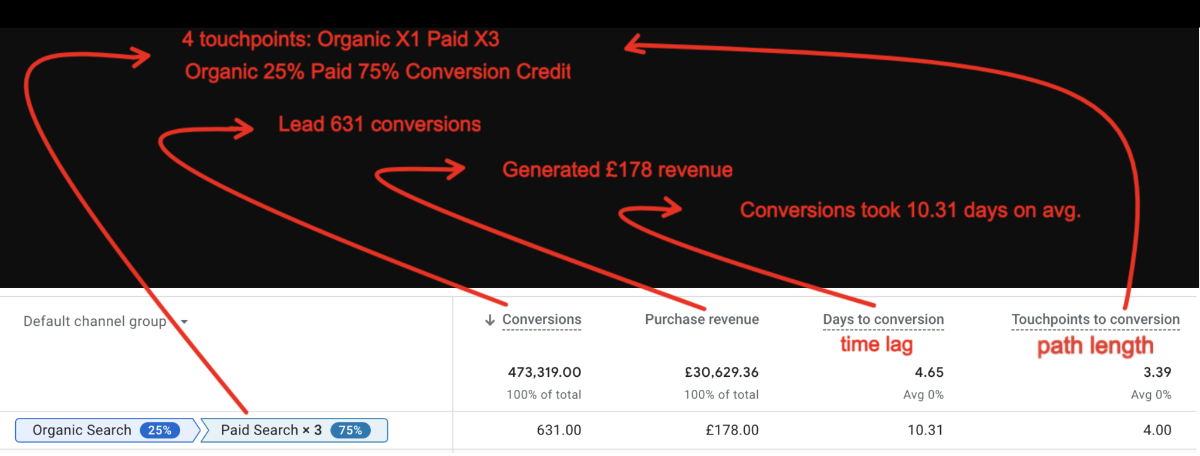
What does the data table tell us …
- People visited 4 touchpoints before convert:
- Organic Search.
- Paid Search X3.
- The Data-driven attribution model assigned:
- Organic Search 25% of the conversion credits.
- Paid Search 75% of the conversion credits.
- For the selected date range, this path:
- Led to 631 conversions.
- Generated £178 revenue.
- Conversions took 10.31 days on average.

Reference and Useful Links #
- [GA4] Conversion paths report by Google: Link
