In this tutorial, we'll take a look at how to use Search Console to monitor your site's performance in Google Search.
The Performance report of Google Search Console (GSC) provides valuable information about your website’s organic search performance in Google.
So, it’s critical in figuring out how people are finding you and how they’re not.

Configuring the report #
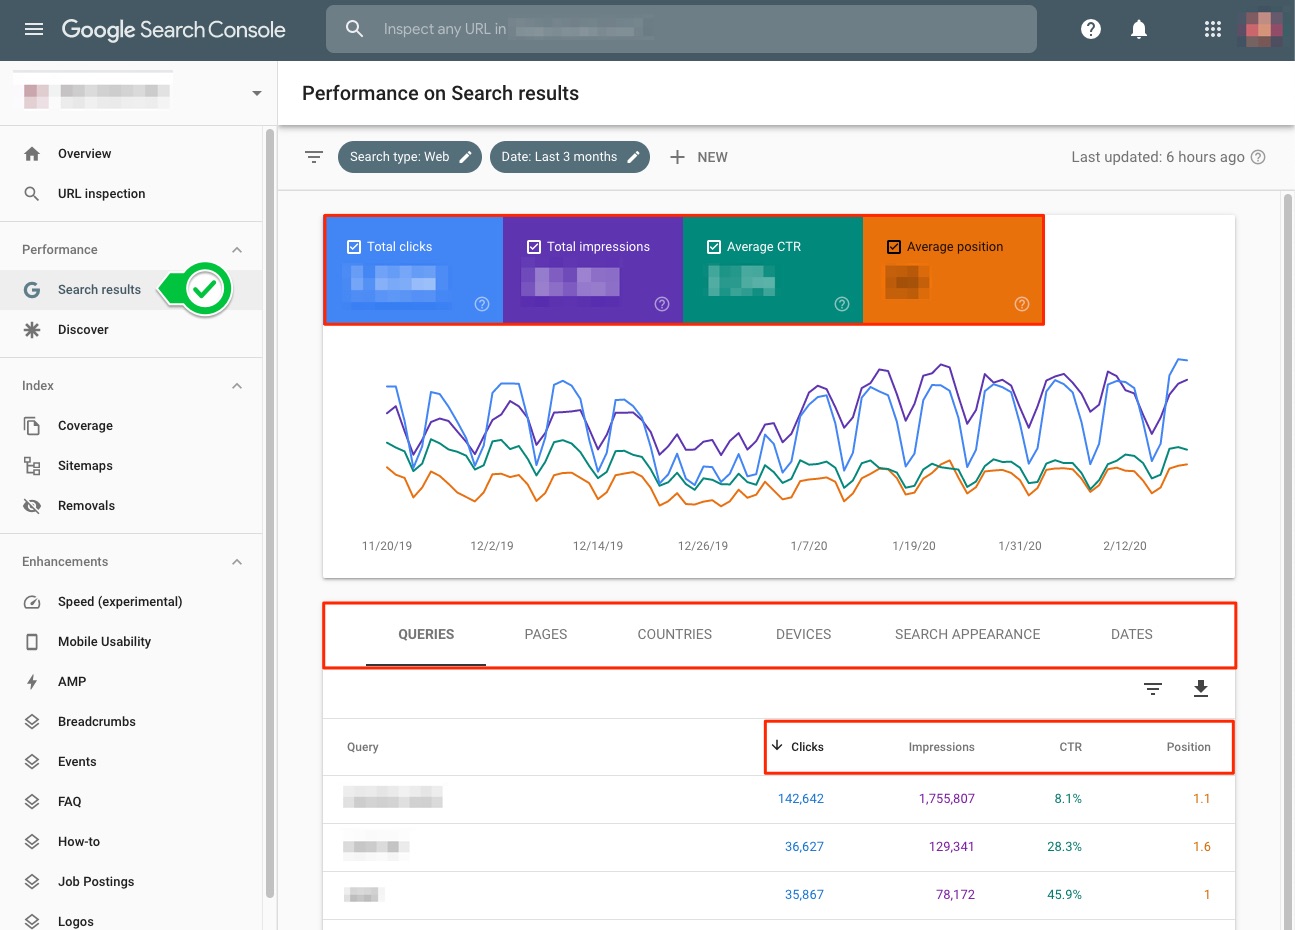
By default are showed the web searches data across the last three months.


The Performance report provides four metrics that can be breakdown by different dimensions and you can use additional filters in order to find everything easier and focus of analysis.


The Google Search Console Metrics #
The dashboard allows enabling four metrics at once: total clicks, total impressions, average CTR and average position. Each of these metrics is selectable. When you enable a metric by clicking on it, Google Search Console displays the data for the metrics sectioned in the performance graph and below the graph in the table.
Let’s look at each of these metrics separately:
Knowing how to navigate Google Search Console is one thing; knowing how all the data are generated and work together is another story.
- Total clicks
Tells you the total number of times someone clicked on your search results during the selected timeframe.
GSC results count a “click” as any mouse click that sends the user to a page outside of a Google search.
This means that a click is registered in Google Search Console only when the user physically leaves the SERP.
Two exceptions to this are:
If a user clicks on a link that keeps them inside the search result, that does not count as a click for the website.
For example, Clicking on query-refinements, such as a carousel that points to a new search, is not counted as a click.
If a user click on a search result to an outside page, returning to the search and clicking on the same link again – that counts as one single click in GSC, even though they left the SERP twice.
- Total impressions
Tells you the total number of times someone saw your results in search during the selected timeframe.
An impression is recorded as long as your site is listed in the page of results, regardless of whether it’s been scrolled into view.
This means that if you are result number 10 on a Google page and someone clicks on the first result without ever scrolling down to see your link, that still counts as an impression.
Pro Tip: This metric can’t be used to measure your organic reach! because impressions don’t representation of how many users physically view your search result. However this data give you an idea about what specific content people are interested in seeing, which means you can decide whether or not certain keywords are relevant to your business.
Three exceptions to this are:
Listings within carousels must be scrolled into view to count as an impression. But, listings that are visible when the page loads do count as an impression, even if the carousel is located down the SERP and the user needs to swipe down to reveal it.

If an element in the search results does not contain a link that leads off of Google, then it’s not counted as an impression.
In Google Image Search, the image needs to be scrolled into view to be counted as an impression.
If a single search element contains several links (as many do), all links to the site will be counted as one impression for the site. But, if the links lead to different URLs on the same site, then they will be broken out as separate impressions in the Pages reporting.
- Average CTR
Tells you what percentage of the people that have seen your website in the search results also clicked through to your website.
CTR (acronym for Click Through Rate) is the number of clicks divided by the number of impressions.
(Total Clicks) / (Total Impressions) = Click Through Rate
This means that:
If you have a ton of impressions but not so many clicks, it can points to two thing: or users are simply not finding the link relevant to their search or they didn’t view your link. With this in mind, you should take a look at your Meta description and call to action, also improve your headlines and have rich snippets in search results in order to make your site more attractive to users.

Analyze the keywords to see whether they are worth the effort, If they do, we can improve the optimization.
If you have a ton of clicks but not so many impressions, that means that your link is performing very well, it’s just not reaching enough people. In this instance, it would be best to focus on redoubling your SEO efforts, optimising your on page content, and possibly shifting tactics to try and boost those impressions.
Note: Keep in mind that an impression is required to generate a click, but since not every person who views your link will click on it, you will always have more impressions than clicks.
On the GSC performance table, you’ll find some rows of data with no impressions. These are shown as a dash (-) and the CTR is determined to be zero.
- Average Position
Tells you what the average ranking of your site in the time period you’ve selected.
“Average position” is an average (sum of positions divided by the total number of keywords) of your positions for every keyword you rank for.
This means that if a query ranks in
position 1and another query ranks inPosition 6the Google Search ConsoleAverage Position is 3.5[(Position 1 + Position 6) / 2 (total queries)] = 3.5 (Average Position)
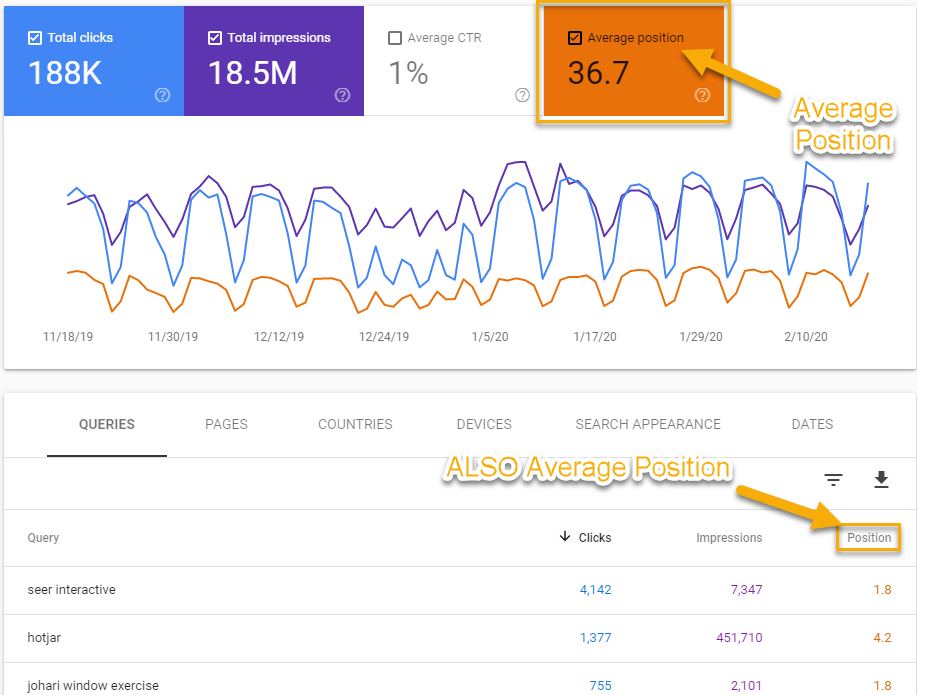
Search Console labels the metric ‘Average Position’ on the Performance graph, but it is displayed simply as ‘Position’ in the Performance table.

In both the cases is the “average position”, the only difference is that the performance graph shows the average positions for every keyword your entire site ranks for, while the performance table shows the average position you rank in for each individual keyword.
Keep in mind that the average position can vary for a number of reasons including, but not limited to: Search history, Location, Personal Preferences.
Multiple listings and Position
When for a query you are ranking with multiple pages of your site, Google takes only the topmost link to your domain in the search results.
For example, if for a query you rank with two separate URLs on Page 1 in Position 1 and 3; GSC counts that as Position 1
Web Search Position
The position is calculated from top to bottom on the primary side of the page, then top to bottom on the secondary side of the page. Google Ads do not count for position, and all links within block elements (such as: carousel, AMP page, images block, featured snippets) have the same position.

For example, in the diagram above, all items in the AMP carousel have position 2; the knowledge Panel have position 6 since it’s on the top-right of the search results (secondary side) so ranked after the last blue-link result on Page 1.
Image Search Position
The position is calculated left to right and then top to bottom.

So, if your image is in the first row, but five position from the left, then it will be counted as position 5
Keep in mind that the number of images per row varies depending on the screen size as well as each image’s width, a wider screen shows more results per row. So, it can be hard to judge the exact meaning of a position value in image search results.
The Google Search Console Dimensions #
Metrics need dimensions, for context, otherwise, it’s just numbers.
The GSC Performance report allow to group these metrics by five different dimensions.
Query: Allow you to see the common keywords people use to find you.
Pages: Allow you to identify your most popular pages.
Country: Allow you to see where your visitors are coming from.
Device: Allow you to see which devices they use.
Search Apparence: Allow you to check how your rich results are doing in search.
Data Filtering #
With 8 black and white columns of data across 4 metrics and comparing 2 time periods, you really do need a sharp eye. Insights slip through the cracks, exploration is limited and opportunity stays hidden.
To ensure you are only looking at meaningful data, the performance table allows to filters out the data.
The value for the filter to include or exclude rows, depending on the operator.
IMG
The operators available depend on whether you are filtering a dimension or a metric.
Dimension filter operators
contains: The row value must either contain or equal the text you enter (non-case-sensitive).
notContains: The row value must not contain the text you enter either as a substring or a (non-case-sensitive) complete match.
Metric Filter operators
Equals: The row value must exactly equal the value you enter.
notEquals: The row value must not exactly equal the value you enter
Greater than: The row value must exceed the value you enter.
Smaller than: The row value must be less than the value you enter.

Looking forward to reading more. Great blog article.Really thank you! Really Great.
Thanks again for the blog.Really thank you! Really Cool.
Hey, thanks for the post.Much thanks again. Really Cool.
Im obliged for the blog article.Really looking forward to read more. Fantastic.
Very neat post. Cool.
Really enjoyed this blog. Keep writing.
I loved your blog post.Thanks Again. Great.
I cannot thank you enough for the article post.Really thank you! Great.
Very good blog.Really looking forward to read more. Really Cool.
Thanks so much for the article post.
I really enjoy the article post.Much thanks again. Want more.
I really liked your article post.Really looking forward to read more. Much obliged.
I appreciate you sharing this article.Really thank you! Awesome.
I really liked your blog.Really thank you!