In this post, I’m going to explain what the difference is between dimensions and metrics.
Know the Difference #
Google Analytics has two kinds of data: Dimensions and Metrics.
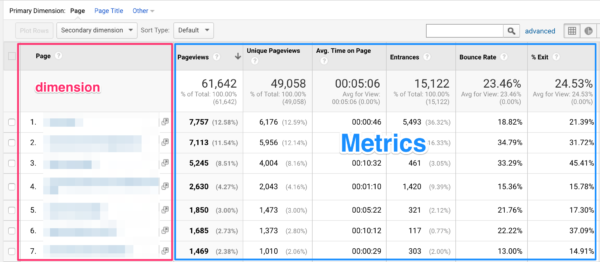
- Dimensions describe the data
Dimension is an descriptive attribute of a visitor to your website – where they came from, their location, which device used etc.
- Metrics measure the data
Metric show you what a user did on your site, expressed in numbers – “how many visits” or “how long a visitor was on the site.”
Metrics need dimensions, for context, otherwise, it’s just numbers.
So, you might think “A metric is a number and a dimension is a text”.
Not really, in most cases this is true, but not always.
Of course, some dimensions are expressed in numbers, like hour and date but these numbers not how or what the user is doing on your site. Dimensions describe the data that’s collected.
If you are looking at your Analytics reports, dimensions are located in rows and metrics in columns.

Metrics and Dimensions Combination #
When creating custom reports, it is important to remember that not every metric can be combined with every dimension. Only when dimension scope matches metric scope will the data make sense.
Use this ever evolving list of metrics and dimensions in Google Analytics.
Don’t Memorize the Complete List
There are simply too many metrics and dimensions in Google Analytics.
You will get a headache and there is no need for knowing them all.
If you are getting more and more proficient in working with them, you will know which are useful and in what situation.
Metrics #
Metrics help understand behavior of your visitors.
Metrics help understand behavior of your visitorsThey measure how often an action is taken, a behavior occurred. For example, how many people use your app in a month, on average. Or, how many website visitors you had in a week. Metrics can also track desired actions, like newsletter subscriptions, and give you a subscription growth ratio month over month.
One of the most common metrics to track is the number of unique visitors or users who came to your website during a specified period of time. By analyzing this metric, you will be able to better understand your website audience. For example, you can separate the visitors into new and returning to find out the differences in interest and intent of these distinctive groups.
Reference and Useful Links
- Dimensions and metrics by Google: Link
- Dimensions and metrics by Paul Koks: https://online-metrics.com/metrics-and-dimensions/” target=”_blank” rel=”noopener”>Link

Major thanks for the post.Thanks Again. Fantastic.
Really informative article post.Really thank you! Fantastic.
I loved your blog post. Great.
Thank you for your article post.Thanks Again. Cool.
I am so grateful for your blog.Thanks Again. Awesome.
Thanks again for the post. Will read on…
Thank you ever so for you post.Thanks Again. Awesome.
Im obliged for the article.Much thanks again. Great.
I cannot thank you enough for the blog article.Really thank you! Keep writing.
Thanks-a-mundo for the blog. Fantastic.
Really appreciate you sharing this article.Really thank you!
Great, thanks for sharing this blog article.Thanks Again. Cool.
Appreciate you sharing, great blog article.Really looking forward to read more. Keep writing.