In recent years, the concept of warehouse-native analytics has gained traction, and there's been much debate about its future in the analytics landscape. Is it just another passing fad or a game-changing evolution in how we handle data?
Introduction to Warehouse-Native Analytics #
Warehouse-native analytics is defined by the integration of data storage and analysis within the same environment, namely the data warehouse.
Warehouse-native analytics means analyzing data where it lives (instead of pulling it out into separate tools):
- A data warehouse is where your data lives
it’s the central hub for storing and processing structured data. - Warehouse-native is where the analysis happens
directly inside the warehouse, without duplicating or exporting the data elsewhere.
This model enables companies to optimize data management and analytic processes by keeping all their data centralized, thereby maintaining transparency and integrity in the metrics they compute.
The method stands in contrast to the traditional practice, commonly referred to as “traditional analytics” or “packaged analytics”, where data is sent to various external platforms, which can lead to data fragmentation and security concerns.
A Historical Context #
To understand warehouse-native analytics, it’s important to first revisit how digital analytics has evolved.
The journey of digital analytics began with companies storing all their web traffic data in-house, using basic log files for tracking and analysis.
Over time, the advent of cloud-based SaaS platforms like Google Analytics shifted the paradigm, with data being sent to third-party servers for processing.
Although this model has been effective for nearly two decades, nowadays the rising concerns about privacy, data security, and regulatory compliance (e.g., GDPR) have led to significant changes, with businesses increasingly migrating their data back to cloud data warehouses such as Snowflake, Redshift, or Google BigQuery.
Alongside this shift, a new generation of tools — like Mitzu and Netspring (which was recently acquired by Optimizely) — has emerged. These platforms can query data directly in the warehouse, rather than duplicating it into separate storage systems. Mitzu, for instance, is warehouse-native by design and works on top of all the aforementioned warehouses, enabling analytics without extracting or duplicating data. The platform automatically generates SQL queries, so non-technical users can explore data and build dashboards without writing a single line of code. It’s also designed for self-service BI, meaning teams outside the data department can run their own analysis — quickly and independently. While the initial setup may take some planning, actual queries typically run in just seconds.
Other platforms, like PostHog, are not warehouse-native by default (they do not query data directly in the warehouse), but offer options to sync with your data warehouse. PostHog is an open-source product analytics suite that originally stored data in its own backend, but it has added some flexibility for teams who want more control over data infrastructure.
Latency → Syncs delay insights (vs. real-time queries).
Legacy analytics tools like Amplitude and Mixpanel are also evolving toward warehouse-native capabilities, offering integrations and syncs with cloud data warehouses. Amplitude, for example, has recently introduced warehouse-native capabilities for Snowflake (native), but other warehouses require syncing. Mixpanel, on the other hand, still relies primarily on its own data pipelines and does not currently support warehouse-native querying.
Data Duplication → Higher costs, compliance risks.
|
Type |
Examples |
Pros |
Cons |
|---|---|---|---|
| Cloud Data Warehouse | Snowflake, Redshift, BigQuery | Centralized, scalable storage & compute for all data | Requires setup and SQL expertise, not an analytics tool on its own |
| Warehouse-Native | Mitzu, Optimizely | No ETL, fast queries, privacy-friendly, no SQL required, data stays in-house | Initial setup can be slow |
| Hybrid (Partial Native) | Amplitude (Snowflake only) | Some direct query capability, familiar UI | Limited to specific warehouse, some duplication |
| Warehouse-Sync Only | PostHog (optional sync) | Open-source flexibility, some warehouse integration | Data copying required, not fully native, latency |
| Legacy Analytics | Mixpanel | Broad feature set | Not warehouse-native, data duplication |
| Open-Source | PostHog, Matomo | Full control, customizable | Requires self-hosting/maintenance |
| SaaS (Traditional) | Google Analytics, Adobe Analytics | Easy setup, rich features | Data silos, sampling, privacy risks |
These developments are prompting a rethink of how companies handle analytics — not just where the data lives, but how it’s analyzed and by whom.
Traditional Analytics Limitation #
Traditional analytics tools typically cater to product and growth teams by providing initial insights such as user visits or feature usage (e.g., “Feature X has high user engagement”).
However, when it comes to answering deeper business-related questions, like the financial impact of a particular feature (e.g., “Feature X drove $2M in additional revenue), these tools often struggle due to their inability to integrate additional data from operational systems such as sales and customer support.
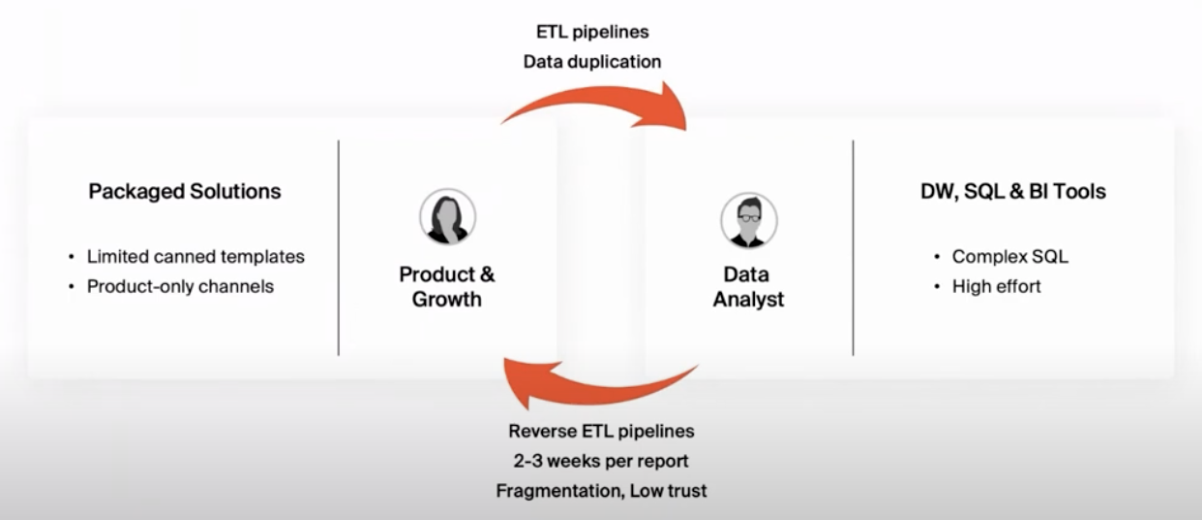
This situation frequently leads to a fragmented analytical workflow, requiring data to move through different stages and hands within an organization, involving the use of various tools and SQL queries, and potentially resulting in weeks of waiting for insights.
Also, when data is copied across multiple tools and systems, inconsistencies arise. It’s common to hear complaints like, “The numbers in my product analytics tool don’t match the numbers in my BI tool”. This lack of trust in the data reduces the efficiency and effectiveness of analytics efforts over time, resulting in diminishing ROI.
Architecture and Data Flow #
To understand the practical implications, let’s walk through the typical workflow of the traditional analytics approach, and then compare it with warehouse-native methods.
Traditional Analytics Workflow #
A Fragmented Journey
Imagine a scenario at a mid-sized tech company where a product analyst needs to evaluate the impact of a new feature on user engagement and revenue. The traditional process unfolds as follows:
- Data Collection: The product analyst gathers initial usage data through a third-party product analytics tool. This data includes metrics like user session lengths and feature interaction rates.
- Initial Analysis: Using the analytics tool’s built-in capabilities, the product analyst creates a preliminary report showing high engagement with the new feature. However, to understand its impact on revenue, further analysis is needed.
- Requesting Deeper Insights: The product analyst sends a request to the data team, asking them to merge the engagement data with sales figures to assess the revenue impact.
- Data Export and Integration: The data team retrieves the engagement data exported from the third-party tool and imports it into the company’s data warehouse. They then write SQL queries to combine this data with sales data stored in the same warehouse.
- Analysis by Data Team: Using BI tools, the data team conducts a detailed analysis, which may take several weeks due to their backlog and the complex nature of the queries required to integrate and process the disparate data sets.
- Reverse ETL: Once the analysis is complete, the data team often uses reverse ETL processes to send the enriched data back to the product analytics tool for further use and visualization by the product team.
- Delivery of Insights: The final report, taking perhaps three weeks from the initial request, shows that while the feature is popular, it isn’t significantly contributing to revenue. This insight arrives possibly too late to make timely product decisions or adjustments.

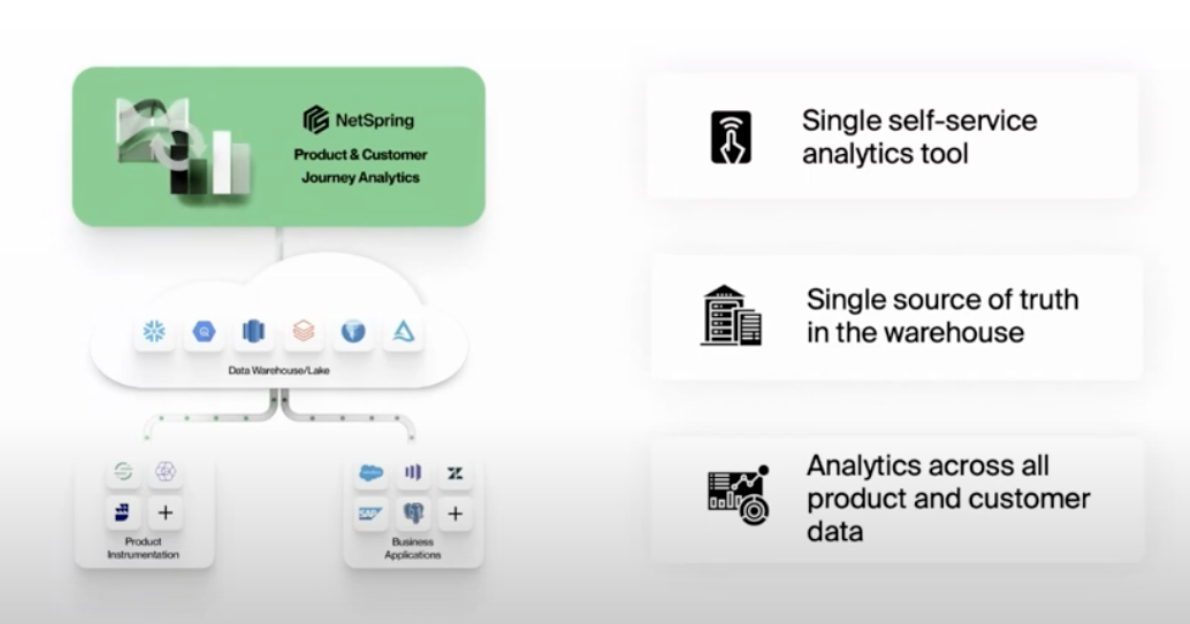
Warehouse-Native Analytics Workflow #
Streamlined and Integrated
Now, let’s consider the same scenario at a company using warehouse-native analytics:
- Data Collection: All user interaction and sales data are directly ingested into the company’s central data warehouse.
- Storage and Management: As soon as new data is available, it is automatically processed and transformed within the warehouse using pre-defined SQL scripts. This reduces the need for manual data handling and accelerates the availability of data for analysis.
- Processing and Transformation: Since all relevant data resides in the same warehouse, the analyst can quickly iterate on queries to retrieve the necessary data to determine the user engagement and the revenue impact of the new feature.
- Immediate Insight Delivery: Within days, or even hours, the product analyst has a comprehensive view of both user engagement and its financial implications. This rapid turnaround enables the product team to make informed decisions swiftly, potentially adjusting strategies in near real-time.

Warehouse-Native Analytics Benefits #
Comparing these two workflows, it’s evident that warehouse-native analytics offers a significant advantage: the business context — additional data from operational systems, such as sales, support, marketing, and customer success.
The real power lies in the business context. When you can connect product usage with support tickets, sales data, and customer feedback in real-time, you start seeing the full picture of your customer’s journey.
By leveraging business context, companies can answer more complex, business-impactful questions.
Here are some real-world business context applications:
-
Revenue Impact Analysis:
- Traditional View: “Feature X has high user engagement.”
- With Business Context: “Feature X drove $2M in additional revenue, with enterprise clients showing 3x higher adoption rates than other segments.”
-
Subscription Intelligence:
- Traditional View: “User retention is up 15%.”
- With Business Context: “Premium tier customers show 40% higher retention, particularly in sectors where we’ve recently expanded our feature set.”
-
Support Integration:
- Traditional View: “New feature launch shows strong adoption.”
- With Business Context: “While adoption is high, 30% of users contacted support within two weeks, indicating potential usability issues.”
But the benefits go far beyond simple metrics. With a single source of truth, insights remain consistent across all data sources, and product and growth teams can independently perform a wider range of analyses without constantly relying on data teams.
Challenges of Warehouse-Native Analytics #
However, there are some trade-offs.
For one, warehouse-native analytics tools typically run slower than traditional analytics tools because the queries are executed directly on the warehouse, which may not be optimized for speed in the same way that SaaS analytics providers are.
Additionally, companies need a skilled data team to manage and maintain the warehouse and the analytics infrastructure, which can be a challenge for smaller organizations with limited resources.
Furthermore, while the potential for deeper insights is appealing, many organizations still struggle with cross-departmental collaboration. For example, marketing teams may not be familiar with the intricacies of data warehousing, and product teams may not have the resources to pull data into the warehouse. This can lead to delays in data collection and analysis, reducing the overall effectiveness of the warehouse-native model.
It’s not just a technical challenge. It’s a cultural shift that requires organizations to fundamentally rethink how they handle information.
The Future of Analytics: Hybrid Models? #
So, is warehouse-native analytics the future? Perhaps. While it offers many benefits, it might not completely replace traditional analytics tools. Instead, a hybrid approach could emerge where certain types of data—such as real-time or critical marketing data—continue to be processed via SaaS platforms, while other, less time-sensitive data (like customer journey data) is handled in the warehouse.
This hybrid model could balance the need for real-time insights with the benefits of unified data storage in a warehouse.

Dear Mauro,
I find your blog interesting, and I am glad you are discussing this topic. At Mitzu, we are building a warehouse-native tool. Could you make a quick feedback, also if you like it could you mention in this blog?
Thank you very much. I also added you to LinkedIn for easier communication!
Ambrus Pethes