In this tutorial, we will take a look at the concepts of data sampling, data thresholding and data cardinality within Google Analytics 4, as well as strategies to minimise their impact on the accuracy and reliability of your reports.
About GA4 Data Quality #
Data sampling and thresholding are concepts that have existed to some degree in Universal analytics (GA3) but are implemented a little bit differently in Google Analytics 4 (GA4).
You may have noted that at the top of the GA4 interface, there is an icon next to every report title. Google calls this icon “data quality” and it changes to indicate whether sampling or thresholding is applied or not to the report.
| Icon | State | Message |
|---|---|---|
 |
A green checkmark You are viewing the complete set of available data for the chosen dimensions and metrics. |
Unsampled Reports “This report is based on 100% of available data.” |
 |
An orange alert You are viewing a portion of the available data for the selected dimensions and metrics. |
Thresholding applied “Google Analytics has applied thresholding to this card and will only display the data when the data meets the minimum aggregation thresholds.” |
 |
A red exclamation mark You are viewing a limited proportion of the available data for the chosen dimensions and metrics. |
Heavily sampled exploration “This report is based on <10% of available data. A smaller sample size means that the data in this report is less accurate.” |
To put it briefly and generally, GA4 has two types of data limits: data sampling occurs when your data request exceeds the quota limits, and data thresholding (data hiding) occurs when your data request is based on a limited number of users, making it possible to identify individual users.
GA4 relies on sampling to return data quickly and thresholding to keep it anonymous.
Do not confuse the GA4 data limits with the GA4 row limits. When the underlying table that populates the Google Analytics 4 report reaches its row limit, any data exceeding that limit gets consolidated into a separate row called “other”. This concept is referred to as “data cardinality“.
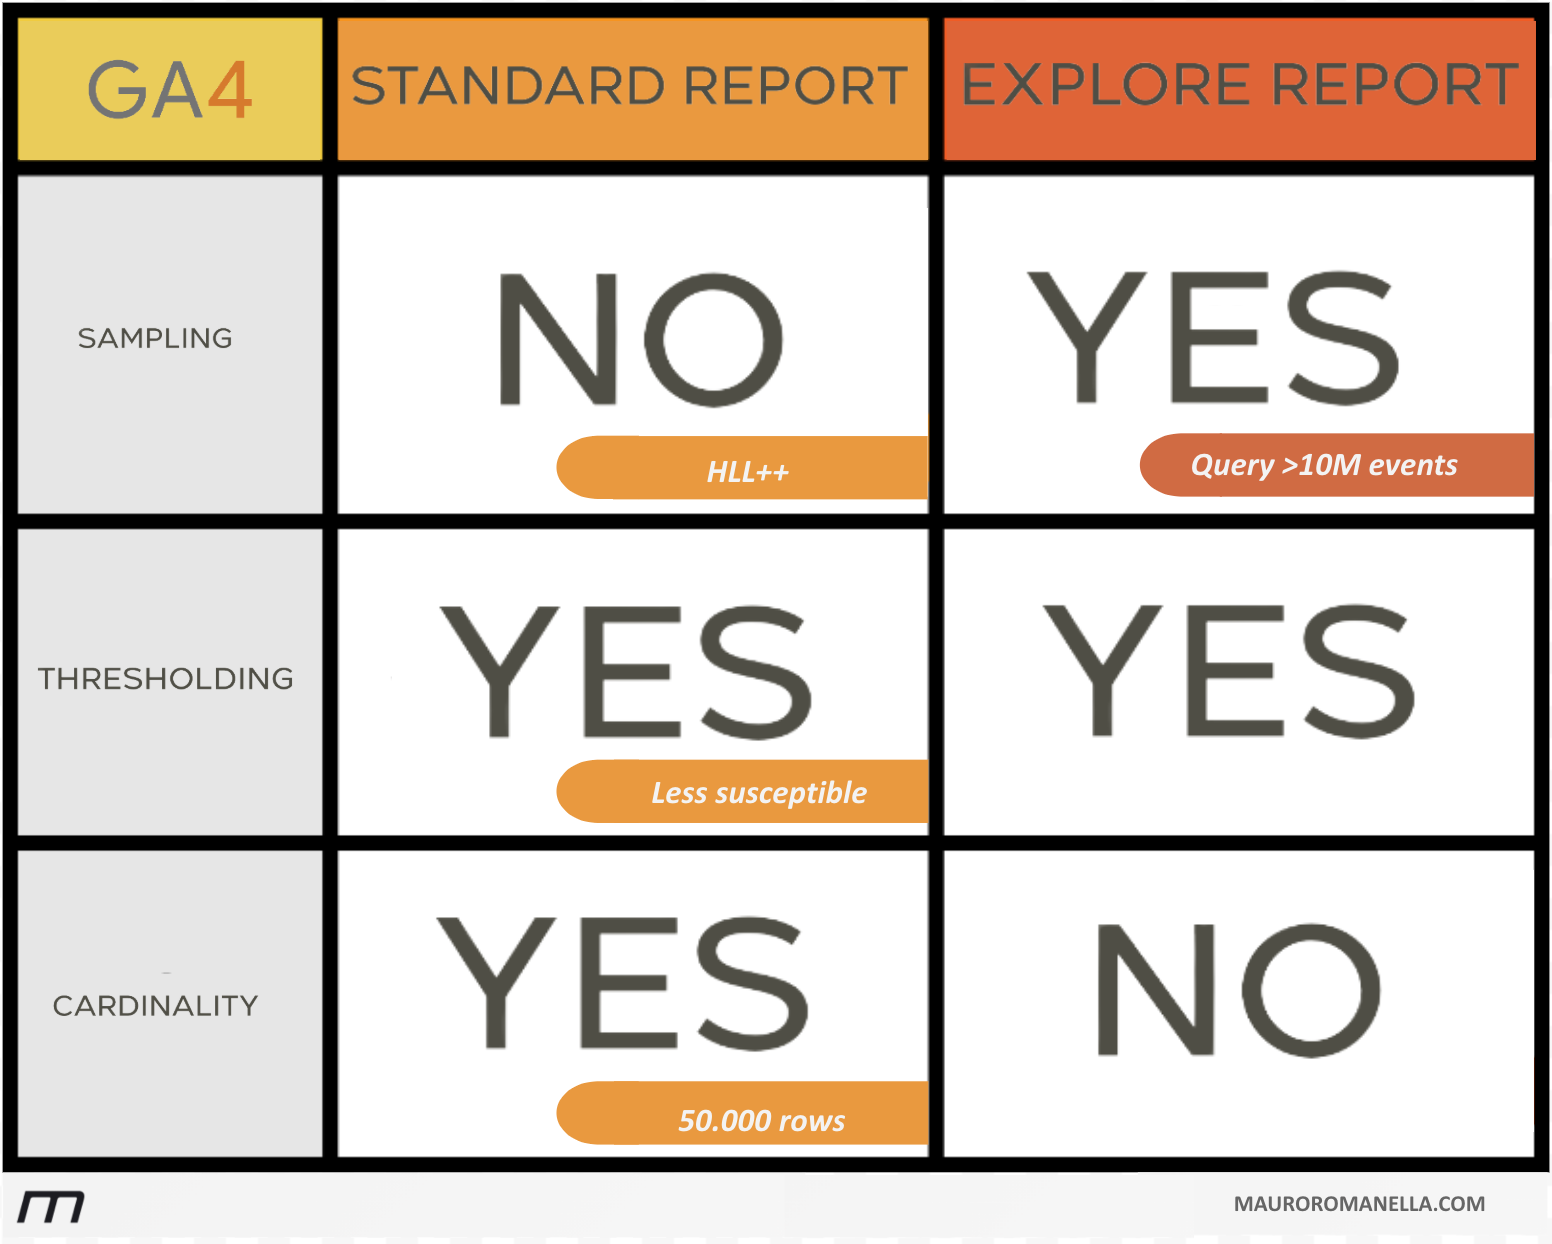
Below a summary table of GA4 data limits (sampling, thresholding, cardinality) based on the report type (standard or explore):
Standard Reports |
Exploration reports |
|
|---|---|---|
GA4 Sampling |
No | Yes Query >10M events |
GA4 Thresholding |
Yes Less susceptible |
Yes |
GA4 Cardinality |
Yes 50,000 rows |
No |
ISSUE: In all three cases, the report may not be representative of the entire dataset, and may not be accurate enough to make decisions based on it.
SOLUTION: Linking GA4 to BigQuery is a good solution to all three cases.
Sampling. By linking GA4 to BigQuery, you can get access to the unsampled data in raw format. This means that you can access and analyze your data in BigQuery without having to worry about sampling.
Thresholding. By linking GA4 to BigQuery, sensitive user data (from Google Signals) will not be passed to BigQuery. This means that you can avoid thresholding in explore reports that use Google Signals data.
Cardinality. By linking GA4 to BigQuery, you can store all of your data in BigQuery, which does not have a cardinality limit. This means that you can avoid the row limit error and get access to all of your data, even if it contains high-cardinality dimensions.
In details:
GA4 Data Sampling #
What is … #
Sampling is a method that allows Google Analytics to generate reports by examining only a representative portion of the data, rather than querying the entire dataset.
Do not confuse data sampling with HyperLogLog++ (HLL++) algorithm.
Data Sampling and HyperLogLog++ (HLL++) algorithm are two different techniques used in Google Analytics 4 (GA4) to estimate large datasets. While both methods provide approximations, they serve distinct purposes and have varying levels of accuracy.
- Data Sampling: Selects a subset of data to represent the entire population.
- HyperLogLog++: Estimates cardinality (number of distinct values).
Why it happens … #
This approach allows Google to be efficient in compute costs, but this can lead to situations where it is provided an approximate value instead of the exact value.
The typical margin of error
Several users have observed that average error rates are around 5%, though they can rise to as high as 30% for smaller ranges.
|
Sampling Rate |
Avg Error (Absolute) |
Range |
|---|---|---|
| 6.25% | 7.80% | 25.49% |
| 10.65% | 8.99% | 38.07% |
| 15.96% | 8.51% | 33.45% |
| 25.72% | 1.82% | 5.61% |
| 33.72% | 3.04% | 10.90% |
| 51.60% | 3.94% | 14.43% |
| 68.68% | 3.80% | 17.77% |
| 77.27% | 2.87% | 14.23% |
| 100% | 0.00% | 0.00% |
As shown in the table, even with a 25% sample size, the data remains fairly accurate, with an average error of only around 2%. It’s only when the sampling drops below 25% that the error rates begin to increase significantly.
When it happens … #
Google Analytics 4 (GA4) does not sample data arbitrarily. Instead, it applies sampling based on specific technical thresholds — only within Exploration reports.
There are specific scenarios that can cause sampling to kick in:
- Sampling will be performed automatically in the following situation:
Per-query Event Limit
When: Your query requires processing more than ~10 million events.
Affects: Exploration reports only
Behavior: Displays a sampling warning
GA4 documentation specifies that standard (free) properties can process up to 10 million events per single query (and up to 1 billion events per query in GA360 properties). Exceeding this threshold in one Exploration initiates sampling.
- Sampling is also more likely to occur in the following situations:
Query Complexity Threshold
When your analysis uses:
- Multiple complex segments
- Numerous dimension breakdowns
- Very long date ranges (90+ days)
Affects: Exploration reports only
Behavior: Shows sampling warning
AND / OR
Large-Volume Queries (Processing Threshold)
When any single query would need to scan more raw events than GA4 can handle.
Affects: Only Exploration reports
Behavior: Shows sampling warning
Scenario 1 (Query Event Limit) and Scenario 3 (Query volume) can sound similar because they’re both about “how many events can be scanned.” However, Scenario 3 emphasizes that any scenario in which the total number of raw events being analyzed is extremely large may lead to sampling—even if you haven’t explicitly hit the exact 10M limit.
- Scenario 1 (Query Event Limit) : Describes Google’s published maximum (10 million events for standard properties).
- Scenario 3 (volume) Acknowledges that real-world performance might kick in sampling before or at the 10M threshold because of other factors (e.g., concurrency, property load, or how Google’s internal resource allocation is working at that moment).
How Sampling Differs by Report Type
Google’s documentation states that Standard reports do not use true event-level sampling; still, one could argue they do a form of “approximation” (approximations use HyperLogLog++ algorithms for distinct counts) under extremely large or complex queries—though they never show a sampling warnings.
So, while all real sampling (in the strict sense of thinning out raw data) happens in Explorations, Standard reports can use approximations under certain conditions. It’s not genuine sampling, but it’s close enough in concept that some might lump it under the same umbrella.
Standard reports, unlike Explorations, use pre-aggregated tables where sampling is physically impossible. The raw events needed for true sampling aren’t accessible to Standard reports.
In short:
- Explorations = where actual, raw-event sampling definitely happens.
- Standard reports = never truly sampled, but can be approximated.
Key points:
Standard reports either show complete data or approximated metrics (never sampled)
Explorations are the only reports with true sampling
All warnings are exclusive to Explorations
What can you do … #
- If you wish to remain inside Google Analytics:
- In GA4 Standard, you can reduce the date range. This will decrease the size of the data set to the point where it is smaller than 10 million events to avoid sampling.
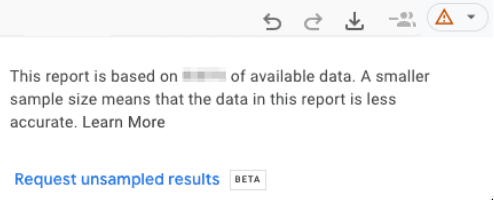
- In GA4 360, Google added a feature that allows its users to toggle between faster analysis (with data sampling size at 100 million of events) or more detailed results (with data sampling size up to 1 billion of events). Also, there is an option to request an unsampled exploration report.
- If you analyse the data outside of Google Analytics, you do have others options:
- Use BigQuery to access your raw data
This is really interesting because previously in Universal analytics this functionality was only available to the paid account.
Tip: Use the Big Query with Google Looker Connector.
- Export your data
You can try to export your data in a shorter time frame and assemble and aggregate it later in your spreadsheet.
Tip: Use GA4 API to pull the data into Google Sheets.
- Use a third-party tool
In case your data is growing rapidly and a Google spreadsheet can no longer store and process your data, you should think about getting a data warehouse.
- Use BigQuery to access your raw data
Faq #
- Does Google Analytics Sampling Affect Data Studio?
Yes.
- Does Google Analytics Sampling Affect API?
Yes.
GA4 Data Thresholding #
Your GA4 reports may not be “sampled” but data threshold could be applied to protect user privacy.
What is … #
Data Thresholding allows Google to withhold data in situations where the algorithm detects a potential risk of identifying a real-world person by their demographics or interests, such as age, gender, location, etc.
Why it happens … #
Data threshold is meant to protect user privacy.
When it happens … #
In Google Analytics 4 (GA4), standard reports do not generally face data thresholds. However, for specific reports, especially those involving sensitive user demographics like age and gender, GA4 does apply data thresholds.
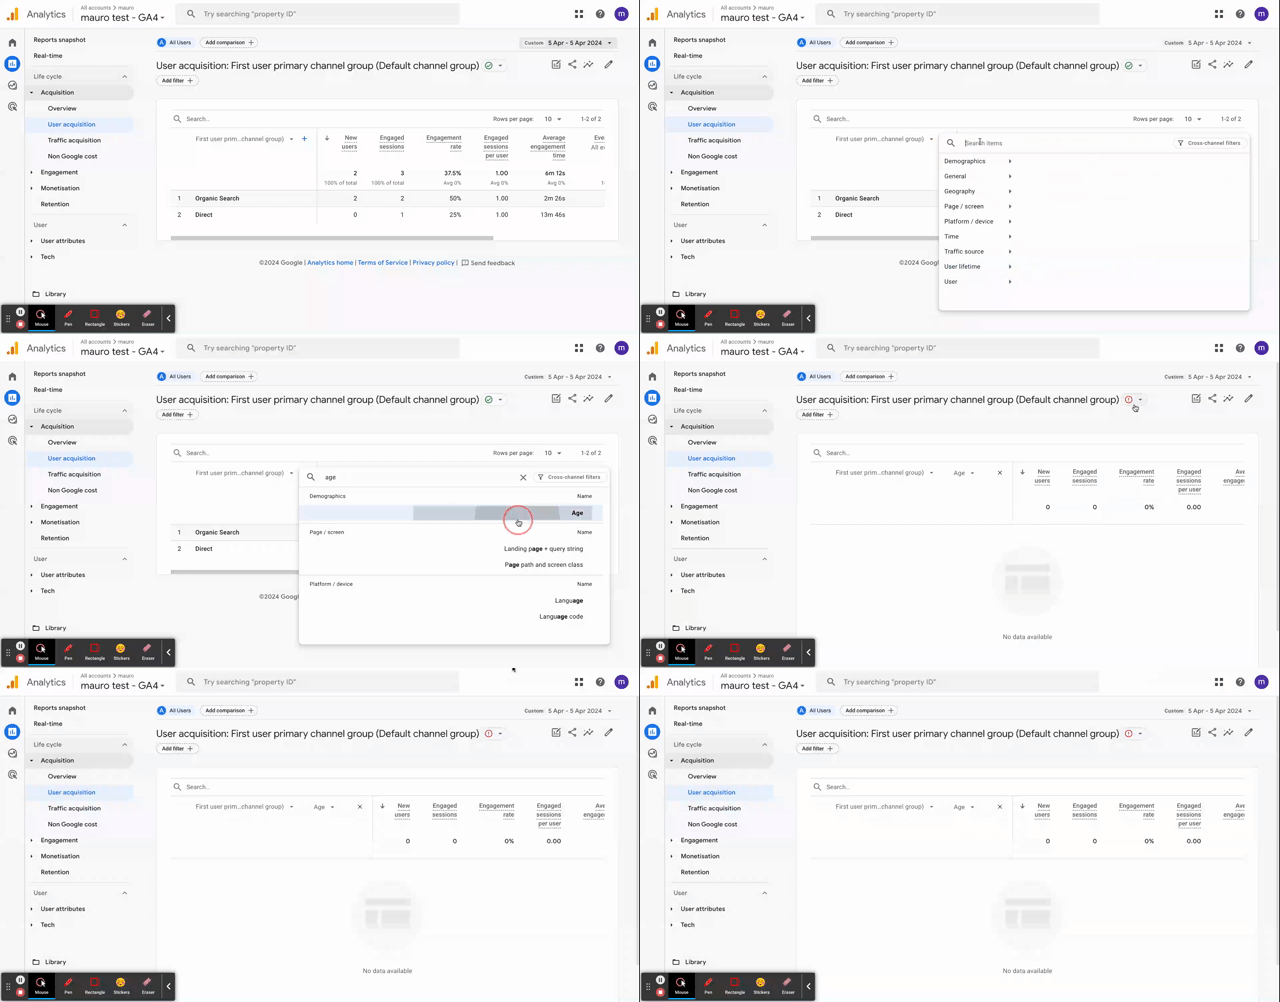
Why GA4 standard report are less susceptible to data thresholds compared to explore reports?
Focus on Aggregated Data: Standard reports typically deal with larger user groups, presenting summarised data. This reduces the chances of revealing individual user information, a key reason for data thresholds.
Pre-defined Metrics: These reports use pre-defined metrics that are less likely to trigger thresholds compared to highly customised explorations where specific user segments might be very small.
In essence, standard reports offer a balance between user privacy and data visibility, while explore reports provide deeper analysis at the potential cost of encountering thresholds for very specific user segments.
Data Thresholding commonly occurs in explore reports when conducting analysis on a small website (user count is low), with Google Signals enabled, over a short data range, like a single day.
What is the limit … #
The specific threshold limit is not explicitly disclosed in Google’s documentation. However, through testing, it has been observed that the threshold limit tends to vary unpredictably, typically falling within the range of 35-40 users or events count.
What can you do … #
Disable Google SignalUpdate Feb 2024: Starting on February 12, 2024, Google Signals will no longer be used for user identification in reports. This means that while Google Signals data will still be collected, it will not be associated with specific users in the reports. This will reduce the application of data thresholds, which were previously used to protect user privacy when dealing with small numbers of users in reports.
Data thresholds are set by Google and can’t be disabled, however,
you do have the option to disable Google Signals (if enabled previously).Note: Even after disabling Google Signals, reports that include user data might still undergo thresholding.
Tip: Consider to setting up an identical GA4 property that does not have Google Signals enabled.
- If you want to keep enabled Google Signals, you do have others options:
- Extend the data range
By extending the data range, you have the opportunity to increase the number of users and potentially reveal any data that was previously subject to thresholding.
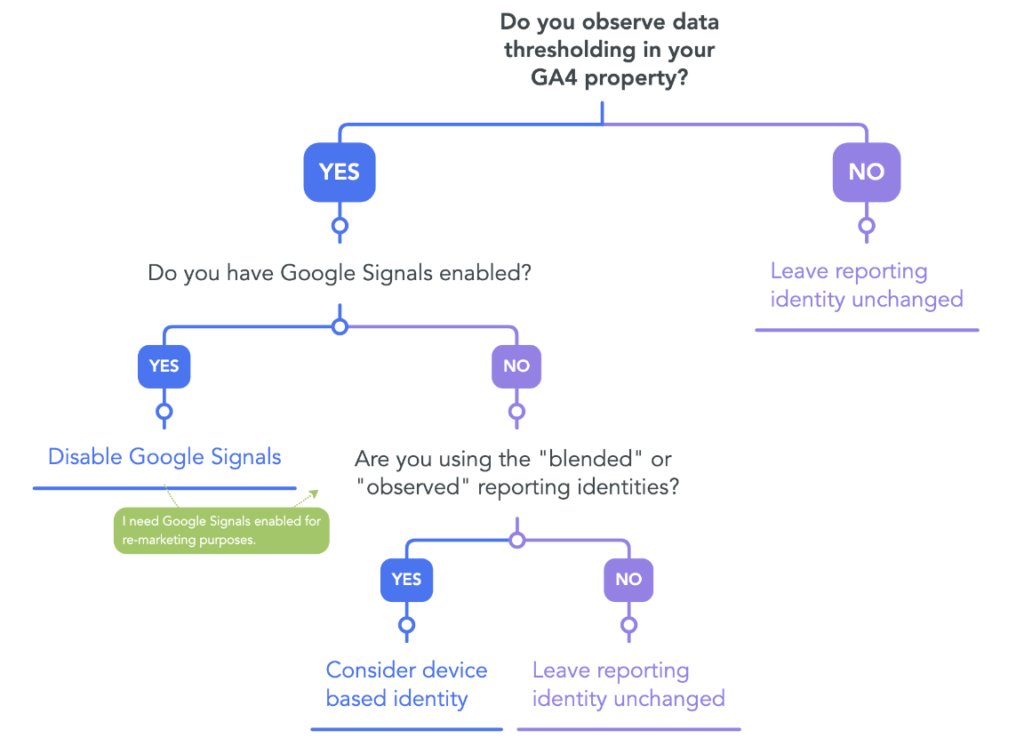
- Use device-based reporting identity
Report identity is a new feature in GA4 that affects how user are calculated within the interface.
There are 3 different calculation methods:
- Blended, this is the most expansive because taken into account: the device id, the user id (if it’s configured), Google Signals (if it’s enabled) and also any modelling through initiatives like Google consent mode.
The reporting identity is set to Blended by default.
- Observed, this works similar to blended, but it excludes any model data, So it only looks at device id, user id (if it’s configured) and Google Signals (if it’s enabled).
- Device-based, this is the least expansive because it only requires GA4 to looks at device ID. If GA4 is unable to identify a user based on their device ID, it will then try to identify the user based on their client ID (i.e., first-party cookies) or the app instance ID (for apps).
According to Google: “When you use device-based reporting, Analytics uses the client ID (i.e., first-party cookies) or the app instance ID (for apps), both of which are not subject to data thresholds in reports with user counts.”
Note: The reporting identity allows you to switch between the options at any time without affecting the data stored in GA’s database. Furthermore, reporting identity is applied to both historical and future data.
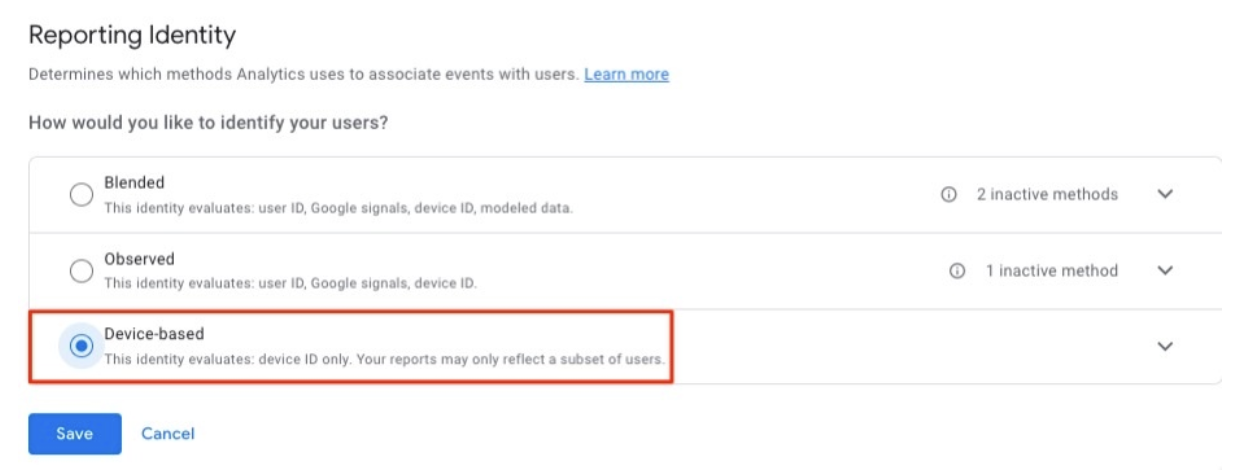
It is important to note that device-based reporting is not the most accurate reporting identity. This is because device IDs can change over time, and they can also be shared by multiple users. However, it is a good option if you are concerned about data thresholding and you need to continue using Google Signals data for re-marketing purposes.
- Blended, this is the most expansive because taken into account: the device id, the user id (if it’s configured), Google Signals (if it’s enabled) and also any modelling through initiatives like Google consent mode.
- Use BigQuery
According to Google: “Analytics doesn’t export data from Google signals to BigQuery”.
Note: since Google Signals deduplicates user counts from individual users, you may see different user counts, and different event counts per user, between Analytics and BigQuery.
- Extend the data range
Faq #
- Does Google Analytics Thresholding Affect Data Studio?
Yes.
- Does Google Analytics Thresholding Affect API?
Yes.
GA4 Data Cardinality #
GA4 data cardinality could be applied to standard to control processing costs.
What is … #
The number of unique values for a dimension is called its cardinality.
For example:
- Consider the following data set:
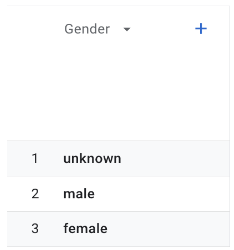
This data set has three unique values: unknown, male and female.
Therefore the cardinality of this data set is three.
- Consider the following data set:
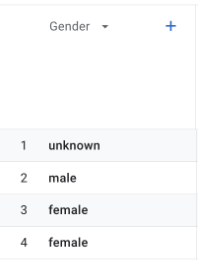
This data set has three unique values: unknown, male and female.
Therefore the cardinality of this data set is three.
- Consider the following data set:
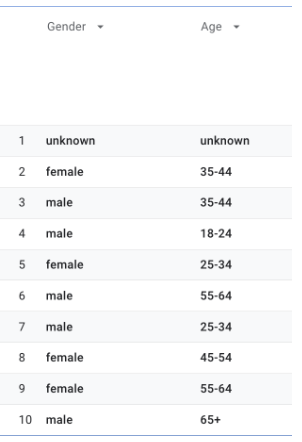
The cardinality of the ‘Age’ dimension is 7, and the cardinality of ‘Gender’ dimension is 3.
Therefore the cardinality of this data set is 21 (7*3 = 21).
Note: The cardinality of the GA4 data table increases as you apply more dimensions to the report.
The examples above are related at a dimension with low-cardinality because having a limed (in this case also fixed) unique value associated.
However, other dimensions, like the Item ID, Page path, or Page location dimension, can have more possible unique values. Imagine an ecommerce with a million different products (item IDs) or a website with thousands of unique pages (page paths). These dimensions would be expected to be high cardinality.
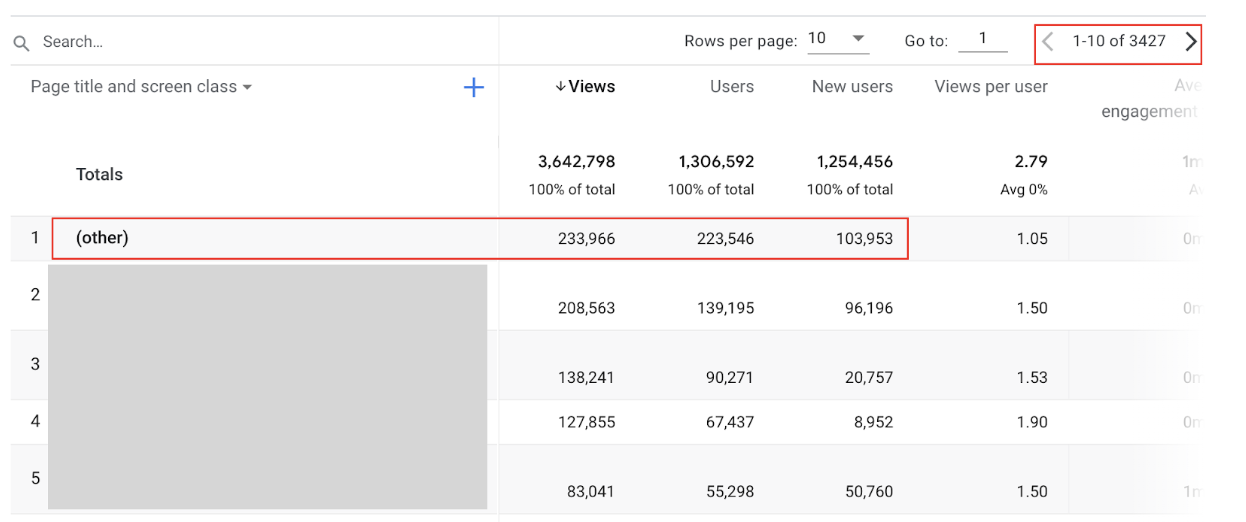
If you have dimensions with high-cardinality (i.e. lots of unique values associated, Google states more than 500 unique values in one day) in a standard report, this can cause Google to group up under “(other)” the data that exceeds these limits.
For example, the report below shows “(other)” due to the dimension “page title” has over 3,000 unique page names.
Why it happens … #
This is because GA4 has limits of how many rows can be stored in daily tables used by standard reports and Data API. These row limits reduce the cost of processing for GA4.
When it happens … #
- Only Standard Reports (including primary and secondary dimensions) and the Data API are subject to the (other) row.
- Explorations and funnel reports are NOT subject to the (other) row.
However, as seen previously they are subject to data sampling.
HyperLogLog++ #
HyperLogLog++ is a probabilistic algorithm that is used to estimate cardinality in GA4.
This algorithm is used for metrics with a high cardinality, such as “Active Users” and “Sessions.”
Since it’s a probabilistic algorithm, it doesn’t count exact numbers but estimates them.
As a result, when you view a report in GA4, you will typically see that the total shown in the Totals row does not equal the sum of the individual rows.
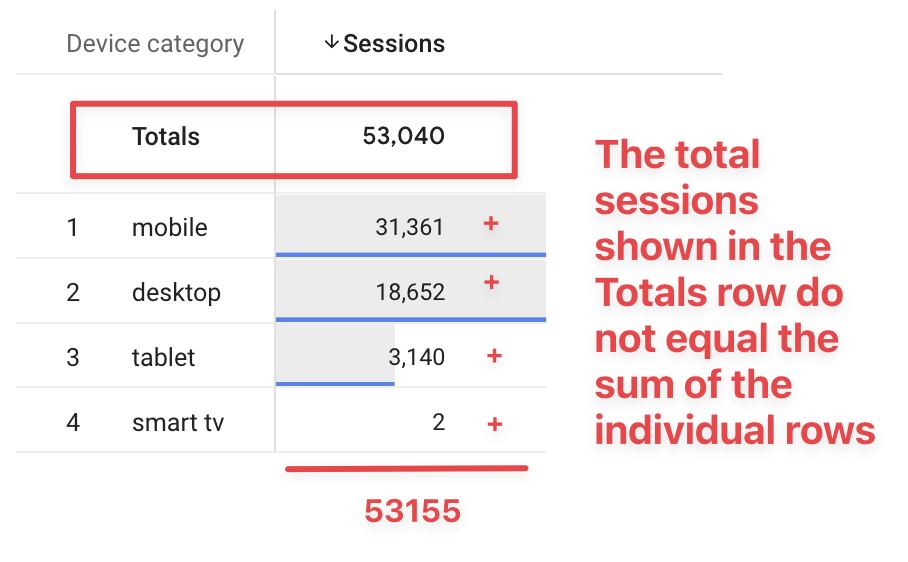
The Total is calculated as an independent estimate across all of the data and not as the sum of individual estimates of each row. Therefore the total result in slight differences compared to the sum.
This is because the Totals row reflects the estimated cardinality of the metric across all of the data in the report, while the sum of the rows reflects the estimated cardinality of the metric for each individual row in the report.
In other words, because it’s estimating rather than counting exactly, the totals you get when adding up individual rows (where each row is an estimation for that subset of data) won’t necessarily match the total estimated cardinality for the entire dataset
In most cases, the difference between the sum of the rows and the value in the Totals row will be small. However, for very large datasets or for metrics with a very high cardinality, the difference may be more noticeable.
What is the limit … #
GA4 Standard Reports retrieve data from pre-processed database tables, also known as aggregated tables (while exploration reports utilise data from raw event and user-level tables).
The aggregated tables underlying the standard report have a limit on the number of rows it will process to produce the standard report data table.
GA4 standard report row limit is 50,000 rows.

The key issue with this is …
In GA4, the determination of cardinality is not based solely on the specific dimension used in the standard report. Instead, it takes into account the entire aggregated table underlying that contains the dimension.
As a result, if an aggregated table contains a dimension with high cardinality, any standard reports built from that aggregated table will be affected by cardinality, regardless of whether the high-cardinality dimension is not used in the standard report.
What can you do … #
If you want to get around this, you have two options:
- Firstly, you can avoid cardinality at the point of data collection by not tracking high-cardinality items like full URLs or query parameters. And avoiding setting user IDs in custom dimensions.
- Or you can avoid using the Standard reports of GA4 entirely and instead use Explorer or BigQuery (which is not affected by cardinality).

Hello, very interesting article, thank you.